
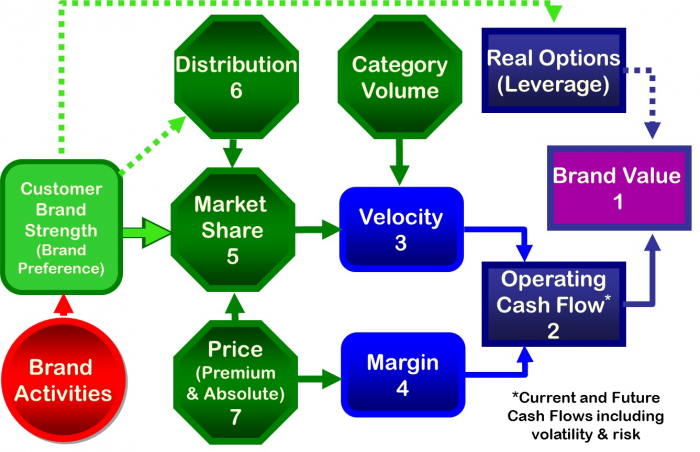
In previous articles and blog posts on The Brand Strength Monitor blog and on the MSW●ARS Research blog, we have provided overviews of how the MASB Brand Investment and Valuation (BIV) model provides a practical, transparent approach for monitoring brand value.

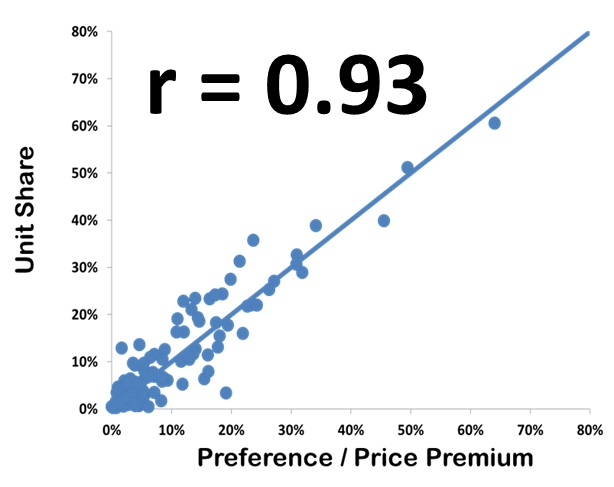
In fact, brand preference and price (premium vs. category average) together accounted for 86% (r= 0.93) of the variance in market share between the one hundred twenty brands tracked in the eighteen month trials.
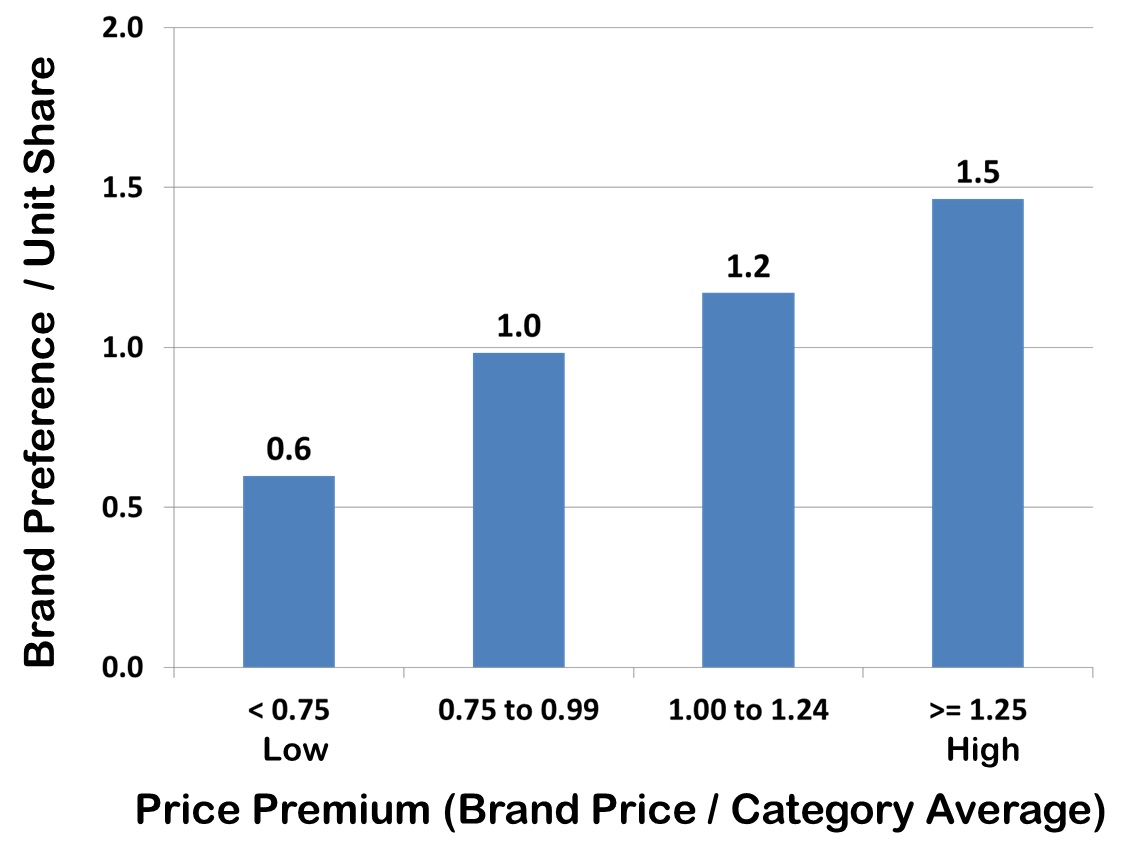
The chart below, from the MASB BIV trials, explicitly demonstrates this interplay between unit market share, brand preference and price. For brands with prices close to category average (represented by a price premium ratio of 1.0), brand preference and market share tend to be equal (represented by a 1.0 ratio between brand preference and market share). But when a brand’s price is high relative to the category average (price premium ratio > 1.0), its market share lags behind brand preference (i.e. brand preference exceeds market share). This is because price conscious consumers are ‘buying down’, that is, choosing brands they prefer less to save money. Contrariwise, when a brand’s price is low relative to the category average (price premium ratio
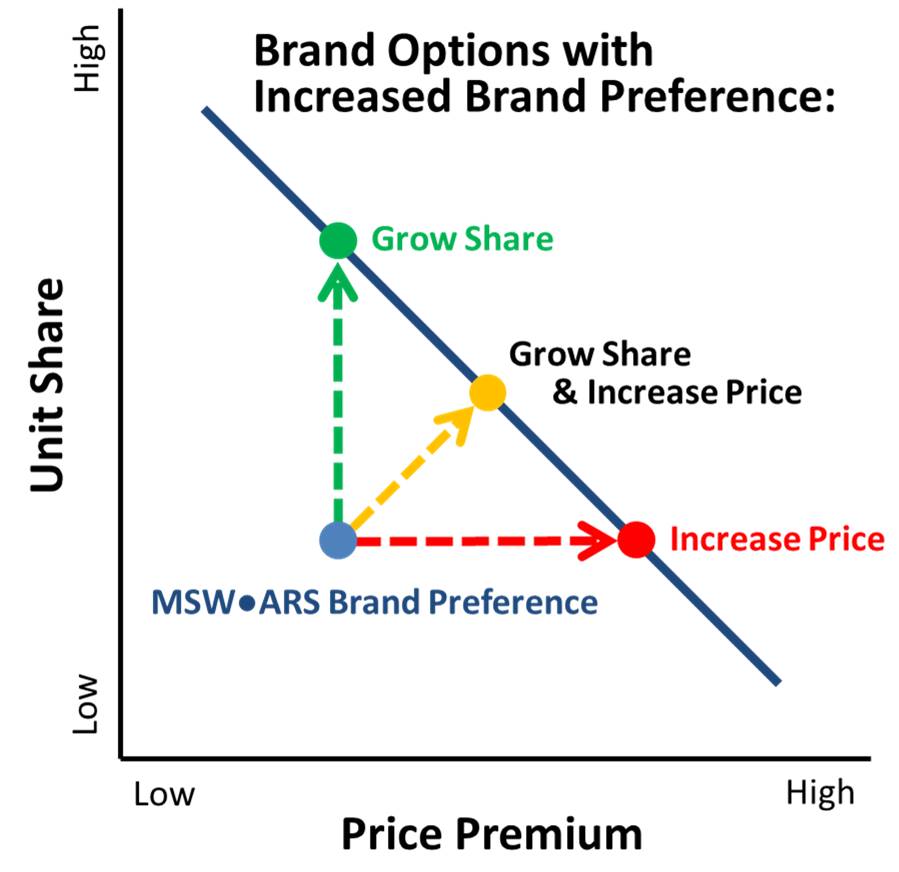
This leaves brand management with an interesting choice. At any given level of brand preference, unit market share can be controlled by ‘tweaking’ price relative to the competition. Of course, there is a danger inherent in this. Just lowering prices could lead to a price war as competitors scramble to maintain their share levels. And just raising prices will cede share to competitors, strengthening them. But what happens if a brand raises preference simultaneously? Then, the brand has many options without these dangers. Say a brand raises their brand preference by five points. They could keep price steady and take all of the gain in the form of a corresponding share increase. The competition will be hard pressed to lower prices, as they will be put in a much weaker financial position. Or the brand could choose to take all of this gain in preference in the form of increased prices, thus improving margins. In this case no share is ceded to the competition so they do not get stronger. Or the brand could choose a mix of growing share and increasing prices.
This brings up another point to remember, to grow brand value it isn’t enough to just grow share, a brand must profitably grow share. In this, price plays a second important role; along with costs it determines margin:
Margins represent a key factor in pricing, return on marketing spending, earnings forecasts, and analyses of customer profitability. In a survey of nearly 200 senior marketing managers, 78% found “percentage margin” and 65% found “unit margin” very useful.
– Common Language Marketing Dictionary
In terms of brand value ‘very useful’ is an understatement! Margin is a critical input into brand valuation. Let’s look at a simplified hypothetical example of three different brands in a billion dollar category, each having exactly the same 10% unit share but arrived at in different ways.
- Brand A has forgone any marketing and so has a relatively low brand preference of 7.5%. To maintain its 10% unit share level it has used very aggressive pricing of $1.5 per unit.
- Brand B spends $30 million a year on marketing of typical effectiveness. This has enabled it to maintain a brand preference level of 10% and a pricing point of $2.00, the category average.
- Brand C also spends $30 million a year on marketing but has best-in-class effectiveness. This has enabled it to achieve a brand preference level of 12.5% and a pricing point of $2.50.
Each of these brands sells 100 million units a year but the cash flow is radically different. Let’s assume that the cost of delivering the 100 million units to market is an identical $120 million for each brand except for the marketing expenditures. Then one year worth of cash flows is:
- Brand A: 100 million X $1.50 – $120 million = $30 million
- Brand B: 100 million X $2.00 – $120 million – $30 million = $50 million
- Brand C: 100 million X $2.50 – $120 million – $30 million = $100 million
The results are dramatically different despite having the same unit market share. Based on these cash flows, Brand C would have a value about twice that of Brand B and three times of Brand A! Of course this is a simplified hypothetical example to demonstrate the principles. Let’s look at a real world classic case study of two brands, Duracell and Eveready batteries.
Alkaline Battery sales began to take off in the late 1980s with Duracell and Eveready starting the race at about the same place. They each sold millions of units more each year to meet the growing demands from electronic devices. But why did Duracell sell more in the end? And how did this affect the value of the brands at the end of ten years?
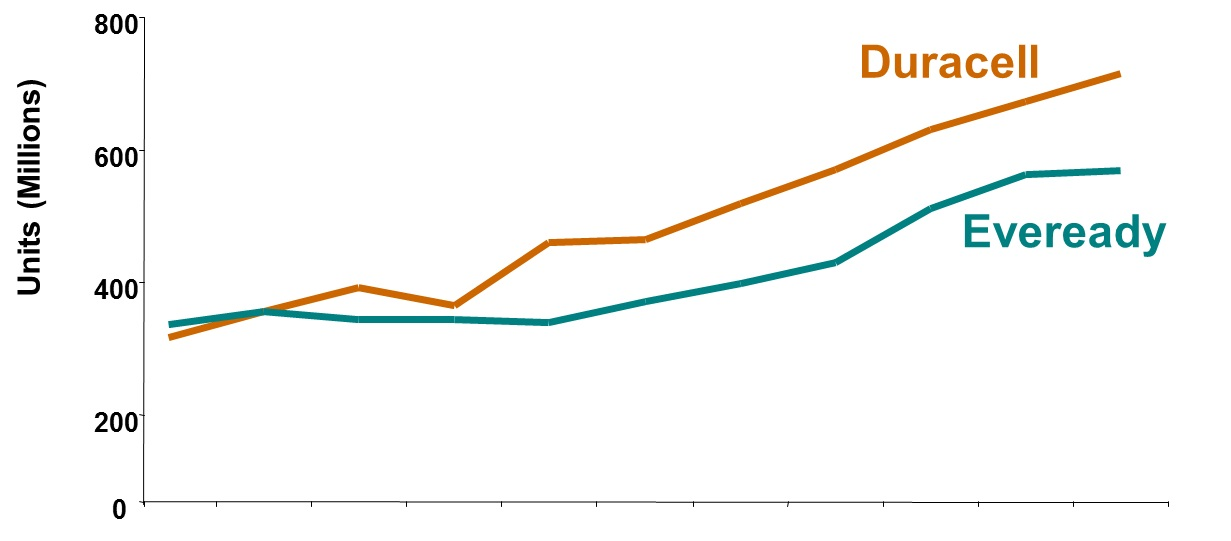
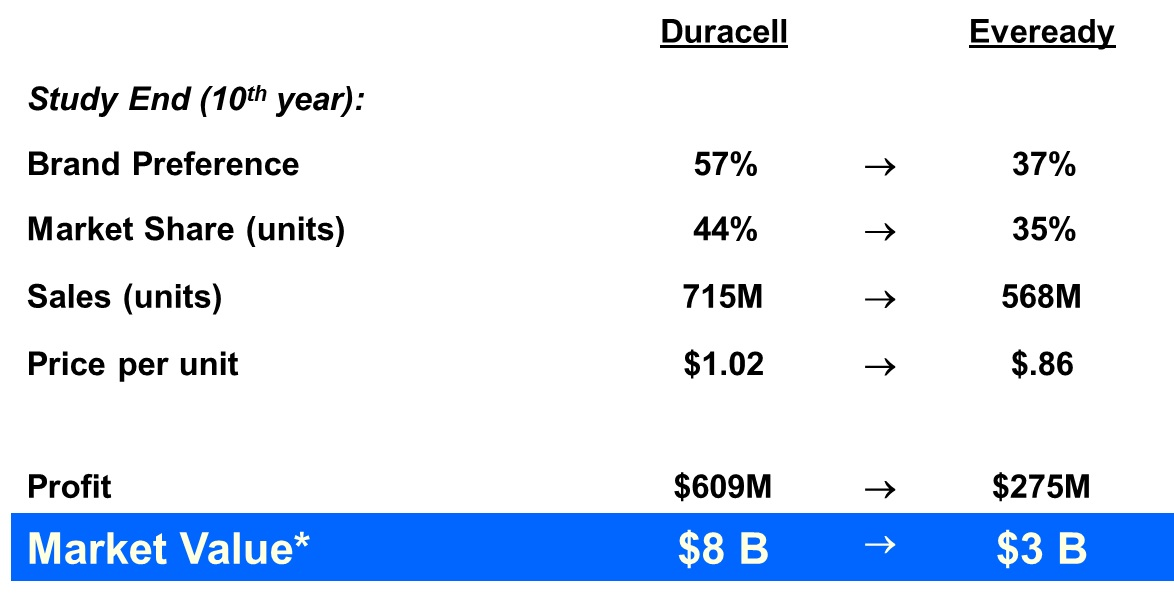
As measured by copytesting, Duracell’s advertising over this time was thirty percent more effective at building preference than Eveready’s. At the end of ten years Duracell’s brand preference had grown to 57% while Eveready’s was 37%. This was enough to not only give Duracell a nine percentage point lead in market share but also to maintain a 19% premium in price over Eveready. And as one of the few rare examples of its type, we have a true market verified value for each brand, as both were sold within one year of the study’s end. Consistent with the MASB BIV model, Duracell achieved a price of nearly three times that of Eveready!
To learn more about The Brand Strength Monitor please contact us at sales@thebrandstrengthmonitor.com.