
It is difficult to watch or read the news without hearing about political divisions in the US. Whether
they’re talking Democrats, Republicans, Libertarians, or the Green Party, there seems to be a lot
of disagreement out there. However, we here at MSW●ARS Research have discovered factions you
may not have even known existed until now – with consumer categories. As a fun repurposing of the
data we collect using our Brand Strength Monitor platform, we are getting to the bottom of
this – one category at a time.
Throughout the 2016 US Presidential Election season we’re sharing some “voting” results. Instead of the
traditional red state/blue state/swing state format, we’re looking at “voting” results for some of
the more than 60 categories on The Brand Strength Monitor Dashboard to determine which brand would
win an election versus its category competitors.
Instead of simply looking at the “popular vote” across thousands of respondents, we decided it would
be a lot of fun to look at results by state Electoral College votes – similar to how the US actually
elects its president every four years.
Thus far, we have included maps for the following categories:
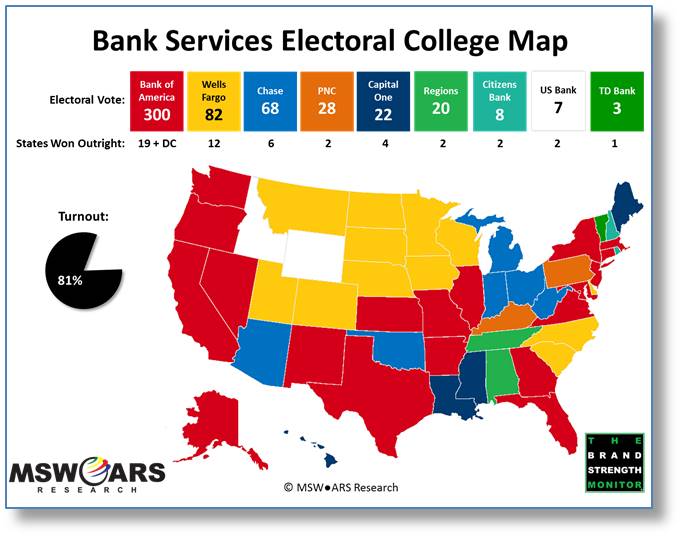
This week, the category is Banking Services.
A lot of the same players exist in this category as did in last week’s category, Credit Cards. Not the least of which is Bank of America – as they are able to come out on top in both categories.
- With Banking Services, they are able to eclipse the 270 electoral vote threshold and come away with a decisive win and a nice round 300 electoral votes. Last week, they were the leader in Credit Cards, but only came away with 216 electoral votes.
- As seen with Credit Cards, Bank of America wins the states with the largest population, which helps them achieve a clear majority. This includes victories in California, Texas, Florida, New York, and Illinois.
- The difference between their performance in this category versus Credit Cards (300 electoral votes versus 216) is their ability to pick up wins in diverse states such as Illinois, Georgia, New Jersey, Maryland, and Nevada.
Wells Fargo is able to achieve second place in the Banking Services race for the presidency with 82 electoral votes and wins in 12 different states.
- Their strengths are mostly in two different pockets of the country: the Carolinas and the north central – stretching from Wisconsin to Montana.
- While Wells Fargo has clear origins in the north central US (Sioux Falls and Minneapolis), their strength in the Carolinas is likely due in part to their acquisition of Charlotte-based Wachovia nearly a decade ago, which expanded their footprint greatly in this part of the country.
Third place again belongs to Chase, as we also saw with the Credit Cards category map from last week. They are able to win a total of six states and 68 electoral votes.
- Most of Chase’s wins here are in the eastern Midwest, including states like Michigan, Ohio, and Indiana. They also run very close to Bank of America, Wells Fargo, and other top companies in various states they do not win outright.
- Again, we see Chase pull out a victory away from the Midwest in Arizona – where they have the naming rights to the stadium for the MLB’s Arizona Diamondbacks, and have had a large presence since their acquisition of Bank One in the late 1990s.
PNC comes away with fourth place and 28 electoral votes due to wins in Pennsylvania and Kentucky.
- Pennsylvania is no huge surprise due to PNC being headquartered in Pittsburgh. The acquisition of National City several years ago allowed them to have a large footprint in Kentucky as well.
Capital One is fifth place with wins in four states and 22 electoral votes.
- Capital One’s largest wins occur in states it also won for Credit Cards in Louisiana and Mississippi. Their success in bank services in this area of the South can likely be largely attributed to their acquisition of New Orleans-based Hibernia last decade.
- Their other two wins in Hawaii and Maine could not be more different from one another. That said, they are narrow victories and not as clear as others due to lower base sizes in these states.
Just out of the top five is Regions with 20 electoral votes and victories in Tennessee and Alabama.
- These victories are not terribly surprising given their headquarters in Birmingham and high presence in the south US. They also nearly won Mississippi and had a good showing in Arkansas.
Citizens Bank is able to win eight electoral votes with wins in the New England states of Rhode Island and New Hampshire. As with other banks, they win states around their headquarters – Providence, in this case.
US Bank, or US Bancorp, had a good showing across the US, but only came on top in the western states of Idaho and Wyoming – netting them seven electoral votes. They nearly won Minnesota and also had very strong showings in Oregon, Nevada, Missouri, and others.
TD Bank is able to come out on top in Vermont, which nets them three electoral votes. While they are certainly not the only major bank with a presence in the state, Vermont is very well within their footprint.
It also should be noted that there are a lot of popular smaller banks out there that have strong presences in various states. When respondents select “Favorite Other Credit Union” or “Favorite Other Bank” we ask them to enter the one to which they are referring. These choices were very popular in states such as Iowa and Indiana.
- As previously mentioned, this data is a by-product of what we standardly collect in our TBSM (The
Brand Strength Monitor) platform. It is the ONLY independently validated measure of brand
value – available for a fraction of the cost of almost all brand health studies these
days.
- Each month, we collect 1,000 respondents for each category, which standardly include roughly the following demographic breakouts for brand choice and category penetration:
- Females: 500
- Males: 500
- African-Americans: ~130
- Hispanics: ~100
- Millennials (Age 35 and Under): ~400
- Non-Millennials (Age 36 and Over): ~600
In addition, the following demographics are also standardly available in many different splits:
- Yes/No Children in Household
- If Yes, Age of Children in Household
- Education Level
- Some High School, High School Diploma, Bachelor’s Degree, Master’s Degree, etc.
- Income Level
- Split 15 ways from $7,500 or less to $200,000 or more
- Marital Status
- Single, Married, Domestic Partnership, Divorced, etc.
- States (as we used in our map above)
- All 50 states + DC, as well as custom regions – if desired
The brands included in this Banking Services exercise are:
- Ally Bank
- Bank of America
- BBT
- BMO Harris
- BNY Mellon
- Capital One
- Chase
- Citibank
- Citizens
- Fifth Third Bank
- HSBC
- Key Corp
- Other Bank
- Other Credit Union
- PNC
- Regions
- Sun Trust
- TD Bank
- US Bancorp
- Wells Fargo
MSW●ARS is already tracking this data for the following categories. Let us know if you see
one you are interested in, or if you would like us to begin tracking your category:
- Antiperspirants/Deodorants (Women)
- Antiperspirants/Deodorants (Men)
- Analgesics, Internal
- Athletic Shoes (Women)
- Athletic Shoes (Men)
- Auto Insurance
- Bank Services
- Bar Soap
- Bathroom Tissue
- Bleach or Laundry Whiteners
- Blue Jeans (Women)
- Blue Jeans (Men)
- Body Lotions (Women)
- Body Lotions (Men)
- Bottled Water
- Breakfast Bars
- Cable or Satellite TV Subscriptions
- Caramel/Toffee Snacks
- Casual Dining Restaurants
- Cell Phone Carriers
- Chewing Gum
- Chocolate Candy
- Cloud Data Storage
- Coffee Machines
- Credit Cards
- Energy Drinks
- Fabric Softeners
- Facial Moisturizers for Women
- Facial Tissue
- Fitness Trackers
- Frozen Entrees
- Hair Coloring (Women)
- Hair Coloring (Men)
- Hair Dryers
- Home/Renters Insurance
- Hotels
- Ice Cream
- Kitchen Cleaners
- Laptop Computers
- Laundry Detergent
- Life Insurance
- Light Beer
- Liquid Hand Soap
- Mayonnaise
- Microwave Ovens
- Microwave Popcorn
- Mouthwash
- Online Movies/TV/Video Streaming Services
- Orange Juice
- Packaged Coffee
- Personal Computers
- Products from a Big Box Retailer
- Quick Serve Restaurants
- Salty Snacks
- Sedans
- Smart Watches
- Smartphones
- Streaming Media Players
- Tablet Computers
- Tea
- Televisions
- Trucks
- Yogurt
If you see some data you would like to see expanded upon, please send us a note at sales@thebrandstrengthmonitor.com.
Thank you for reading and we will continue to release maps for new categories as the 2016
US Presidential Election approaches.