

It is difficult to watch or read the news without hearing about political divisions in the US. Whether
they’re talking Democrats, Republicans, Libertarians, or the Green Party, there seems to be a lot
of disagreement out there. However, we here at MSW●ARS Research have discovered factions you
may not have even known existed until now – with consumer categories. As a fun repurposing of the
data we collect using our Brand Strength Monitor platform, we are getting to the bottom of
this – one category at a time.
Throughout the 2016 US Presidential Election season we’re sharing some “voting” results. Instead of the
traditional red state/blue state/swing state format, we’re looking at “voting” results for some of
the more than 60 categories on The Brand Strength Monitor Dashboard to determine which brand would
win an election versus its category competitors.
Instead of simply looking at the “popular vote” across thousands of respondents, we decided it would
be a lot of fun to look at results by state Electoral College votes – similar to how the US actually
elects its president every four years.
Thus far, we have included maps for the following categories:
This week, the category is Credit Cards.
The map for Credit Cards is interesting as it does not show much regionality or obvious groupings of states – unlike other maps we have seen such as Light Beer and Bottled Water. The closest we have come to this type of map was with Energy Drinks where we raised the point that socioeconomic (and demographic) factors appear to drive preference with the category more than geography – the same is true with Credit Cards.
- For example, from the top we see significant differences between Females and Males – the #1 brand among Males is actually only #3 among Females, and vice versa. A similar dynamic exists among Millennials and Non-Millennials, as well as many other population segments. (All of this data is available upon request for January through July 2016 among 7,000 total respondents.)
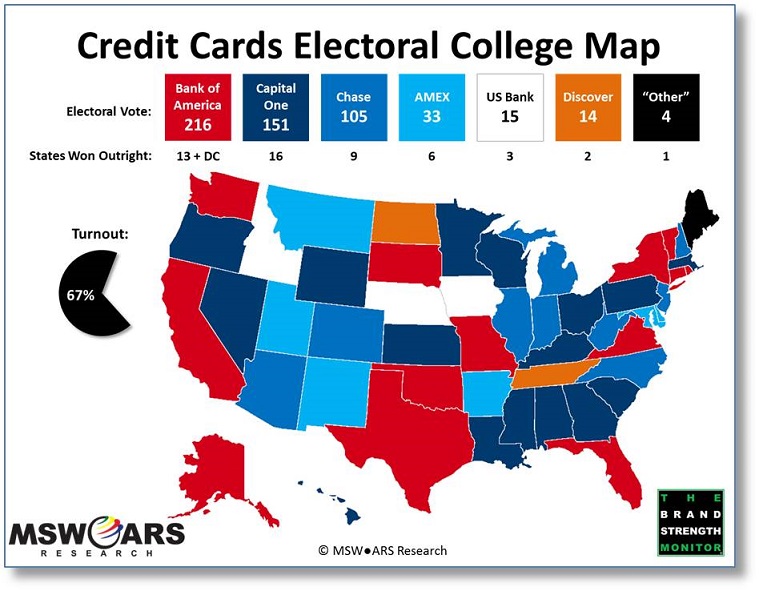
With those caveats in mind and without further delay, here are the electoral map results for Credit Cards:
- There is no clear winner as none of the brands/companies are able to reach the 270 hurdle necessary to clinch the presidency, so this one will be heading to the House of Representatives for the top three vote-getters to duke it out.
The current leader is Bank of America as they are able to achieve 216 electoral votes via an impressive showing across the nation.
- They are able to win the four states with the largest populations in California, Texas, Florida, and New York. This enables them to come out on top even though they do not win the most states.
- The wins in California, Florida, and New York are impressive especially because of the double-digit percentage margins of victory in each. Bank of America wins big in the biggest states.
- The lack of regionality in this category is plainly apparent in Bank of America, the leading vote-getter, not winning North Carolina, where it has its corporate headquarters in Charlotte.
Not far behind the leader is Capital One with 151 electoral votes.
- Despite being behind Bank of America in the electoral vote tally, Capital One actually wins more states than any other company/brand with 16 total victories.
- This includes impressive showings in the South with a sweep of Louisiana through South Carolina, and wins in large states such as Pennsylvania and Ohio. They also win several states in the Midwest/West as well as Massachusetts in the Northeast.
- Capital One is very involved in NCAA sponsorships, such as with the College Football Playoff and the Capital One Cup, which recognizes the best Division I college athletics programs across the country. It may not be a coincidence that states where college football and basketball (the two most watched collegiate sports) are very popular also tend to prefer Capital One – such as Ohio, Alabama, Louisiana, Wisconsin, Pennsylvania, Georgia, Oregon, Kentucky, Kansas, and South Carolina.
Chase comes in third place with 105 electoral votes and victories in nine states.
- As with first and second place, Chase does well to secure wins all across the nation – ranging from Arizona and Colorado all the way up to New Jersey and New Hampshire.
- Chase’s performance in Arizona could be driven somewhat by its sponsoring of Chase Field, home of MLB’s Arizona Diamondbacks.
American Express finishes fourth with 33 electoral votes and victories in six states.
- Though American Express has pretty solid showings in most states, its electoral vote count suffers from not winning any states with large populations. Their victory in Maryland is the only one with at least 10 electoral votes.
US Bank finishes fifth with 15 electoral votes and wins in Iowa, Nebraska, and Idaho.
Discover finishes six and narrowly misses a tie for fifth as it achieves 14 electoral votes with victories in Tennessee and North Dakota.
Finally, we arrive at the state of Maine, which actually chose the “Other” option more often than any of the 17 company/brand choices we gave them (Bank of America and Chase were not far behind). Therefore, they get their own bucket.
- As previously mentioned, this data is a by-product of what we standardly collect in our TBSM (The
Brand Strength Monitor) platform. It is the ONLY independently validated measure of brand
value – available for a fraction of the cost of almost all brand health studies these
days.
- Each month, we collect 1,000 respondents for each category, which standardly include roughly the following demographic breakouts for brand choice and category penetration:
- Females: 500
- Males: 500
- African-Americans: ~130
- Hispanics: ~100
- Millennials (Age 35 and Under): ~400
- Non-Millennials (Age 36 and Over): ~600
In addition, the following demographics are also standardly available in many different splits:
- Yes/No Children in Household
- If Yes, Age of Children in Household
- Education Level
- Some High School, High School Diploma, Bachelor’s Degree, Master’s Degree, etc.
- Income Level
- Split 15 ways from $7,500 or less to $200,000 or more
- Marital Status
- Single, Married, Domestic Partnership, Divorced, etc.
- States (as we used in our map above)
- All 50 states + DC, as well as custom regions – if desired
The brands included in this Credit Cards exercise are:
- American Express
- Bank of America
- Barclaycard
- BB&T
- Capital One
- Chase
- Citi
- Citizens Bank
- Credit One
- Diners Club International
- Discover
- Key Bank
- Other
- PNC
- Simmons Bank
- State Farm
- TD Bank
- US Bank
- Your Favorite Other Brand
MSW●ARS is already tracking this data for the following categories. Let us know if you see
one you are interested in, or if you would like us to begin tracking your category:
- Antiperspirants/Deodorants (Women)
- Antiperspirants/Deodorants (Men)
- Analgesics, Internal
- Athletic Shoes (Women)
- Athletic Shoes (Men)
- Auto Insurance
- Bank Services
- Bar Soap
- Bathroom Tissue
- Bleach or Laundry Whiteners
- Blue Jeans (Women)
- Blue Jeans (Men)
- Body Lotions (Women)
- Body Lotions (Men)
- Bottled Water
- Breakfast Bars
- Cable or Satellite TV Subscriptions
- Caramel/Toffee Snacks
- Casual Dining Restaurants
- Cell Phone Carriers
- Chewing Gum
- Chocolate Candy
- Cloud Data Storage
- Coffee Machines
- Credit Cards
- Energy Drinks
- Fabric Softeners
- Facial Moisturizers for Women
- Facial Tissue
- Fitness Trackers
- Frozen Entrees
- Hair Coloring (Women)
- Hair Coloring (Men)
- Hair Dryers
- Home/Renters Insurance
- Hotels
- Ice Cream
- Kitchen Cleaners
- Laptop Computers
- Laundry Detergent
- Life Insurance
- Light Beer
- Liquid Hand Soap
- Mayonnaise
- Microwave Ovens
- Microwave Popcorn
- Mouthwash
- Online Movies/TV/Video Streaming Services
- Orange Juice
- Packaged Coffee
- Personal Computers
- Products from a Big Box Retailer
- Quick Serve Restaurants
- Salty Snacks
- Sedans
- Smart Watches
- Smartphones
- Streaming Media Players
- Tablet Computers
- Tea
- Televisions
- Trucks
- Yogurt
If you see some data you would like to see expanded upon, please send us a note at sales@thebrandstrengthmonitor.com.
Thank you for reading and we will continue to release maps for new categories as the 2016
US Presidential Election approaches.