
It is difficult to watch or read the news without hearing about political divisions in the US. Whether
they’re talking Democrats, Republicans, Libertarians, or the Green Party, there seems to be a lot
of disagreement out there. However, we here at MSW●ARS Research have discovered factions you
may not have even known existed until now – with consumer categories. As a fun repurposing of the
data we collect using our Brand Strength Monitor platform, we are getting to the bottom of
this – one category at a time.
Throughout the 2016 US Presidential Election season we’re sharing some “voting” results. Instead of the
traditional red state/blue state/swing state format, we’re looking at “voting” results for some of
the more than 60 categories on The Brand Strength Monitor Dashboard to determine which brand would
win an election versus its category competitors.
Instead of simply looking at the “popular vote” across thousands of respondents, we decided it would
be a lot of fun to look at results by state Electoral College votes – similar to how the US actually
elects its president every four years.
Thus far, we have included maps for the following categories:
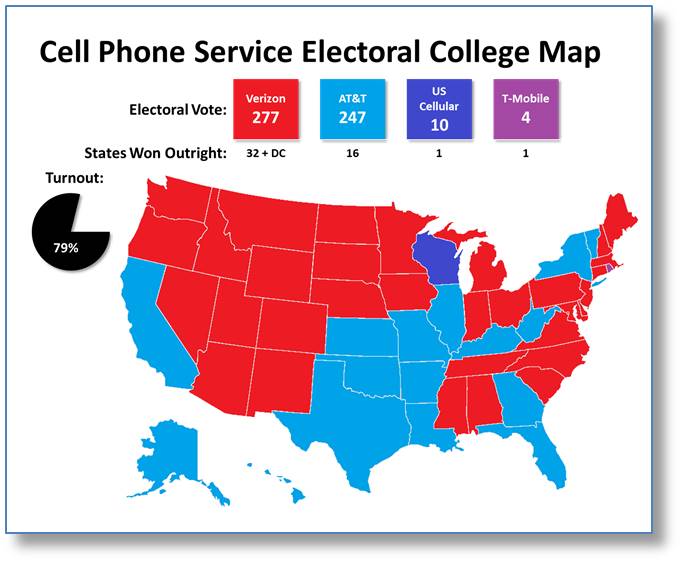
This week, the category is Cell Phone Service/Carriers.
It would be challenging to find a category that utilizes US maps in their advertisings more than this one. “Superior” coverage maps are almost a requirement in order to sway consumers. While we are not necessarily sharing a coverage map, we ARE revealing a brand preference map – which suggests it is more of a “coverage satisfaction” map.
If you are active in this category and/or have been watching advertisements for it, then you probably know that Verizon and AT&T are always in a battle for supremacy. It gives us great pleasure to be able to provide objective data that shows which of these brands would win the presidency. It is our closest decided election thus far!
Without further delay, here are the results:
- Verizon is your president with 277 electoral votes (270 needed) in a nail biter over AT&T.
- They are able to accomplish this by winning 32 out of 50 states in addition to DC.
- Verizon’s biggest differentiation with AT&T in this election is their ability to win rural states with lower populations – and they do so on a very large scale.
- They actually lose the five largest states (California, Texas, Florida, New York, and Illinois) all to AT&T, yet still find a way to win due to racking up large numbers of smaller states.
- AT&T also had a strong showing in this election in achieving 247 electoral votes. If a few additional states had gone their way, then they could have easily achieved the 270 necessary to win.
- As mentioned, they are able to win the five largest states and have a very strong showing from Illinois down to Texas.
- They are also able to snag victories in California, New York/Vermont, and Georgia/Florida, which are otherwise surrounded by Verizon states.
- Their downfall in this election is that they only secured victories in half as many states as Verizon (32 versus 16). This includes being shut out in the Interior West in what is a giant collection of Verizon states ranging from Minnesota, over to Washington state, and down to Arizona/New Mexico.
- AT&T appears to be the preferred brand in the most populous states, but not necessarily the entire nation.
- 48 of 50 states (plus DC) are won by either Verizon or AT&T in this election. However, that is not to discount the impact made by the other companies. Sprint, Tracfone Wireless, Amazon Wireless, Straight Talk Wireless, MetroPCS, Boost Mobile, Cricket Wireless, and others garner a lot of votes, but do not achieve enough to capture any individual state.
- However, US Cellular does get on the board with ten electoral votes via a victory in Wisconsin. They almost also pick up a victory in neighboring Iowa, but lose to Verizon by four points. In both of these states, they are over-indexing their national numbers greatly.
- You may also be aware that Major League Baseball’s Chicago White Sox play at US Cellular Field. They do not come close to winning Illinois, but it is one of their best showings nationwide.
- T-Mobile snags a victory in Rhode Island and gets its four electoral votes in their column. This one is close and may fall under the “low base size in smaller state” section. However, they finish third in the popular vote nationwide and four electoral votes vastly understates their impact on this category. That is the nature of the electoral college though!
- As previously mentioned, this data is a by-product of what we standardly collect in our TBSM (The
Brand Strength Monitor) platform. It is the ONLY independently validated measure of brand
value – available for a fraction of the cost of almost all brand health studies these
days.
- Each month, we collect 1,000 respondents for each category, which standardly include roughly the following demographic breakouts for brand choice and category penetration:
- Females: 500
- Males: 500
- African-Americans: ~130
- Hispanics: ~100
- Millennials (Age 35 and Under): ~400
- Non-Millennials (Age 36 and Over): ~600
In addition, the following demographics are also standardly available in many different splits:
- Yes/No Children in Household
- If Yes, Age of Children in Household
- Education Level
- Some High School, High School Diploma, Bachelor’s Degree, Master’s Degree, etc.
- Income Level
- Split 15 ways from $7,500 or less to $200,000 or more
- Marital Status
- Single, Married, Domestic Partnership, Divorced, etc.
- States (as we used in our map above)
- All 50 states + DC, as well as custom regions – if desired
The brands included in this Cell Phone Service exercise are:
- Amazon Wireless
- Assurance Wireless
- AT&T
- Boost Mobile
- Brightspot
- Consumer Cellular
- Credo Mobile
- Cricket Wireless
- Freedom Pop
- GIVmobile
- Go Phone
- Go Smart Mobile
- H2O Wireless
- Jitterbug
- MetroPCS
- Net10 Wireless
- Other
- Pageplus
- Reach Out Wireless
- Republic Wireless
- Ringplus
- Safelink Wireless
- Simple Mobile
- Sprint
- Straight Talk Wireless
- T Mobile
- Telcel America
- Textnow
- The People’s Operator
- Total Wireless
- Tracfone Wireless
- US Cellular
- Verizon Wireless
- Virgin Mobile
- Walmart Family Mobile
- Your Favorite Other Brand
MSW●ARS is already tracking this data for the following categories. Let us know if you see
one you are interested in, or if you would like us to begin tracking your category:
- Antiperspirants/Deodorants (Women)
- Antiperspirants/Deodorants (Men)
- Analgesics, Internal
- Athletic Shoes (Women)
- Athletic Shoes (Men)
- Auto Insurance
- Bank Services
- Bar Soap
- Bathroom Tissue
- Bleach or Laundry Whiteners
- Blue Jeans (Women)
- Blue Jeans (Men)
- Body Lotions (Women)
- Body Lotions (Men)
- Bottled Water
- Breakfast Bars
- Cable or Satellite TV Subscriptions
- Caramel/Toffee Snacks
- Casual Dining Restaurants
- Cell Phone Carriers
- Chewing Gum
- Chocolate Candy
- Cloud Data Storage
- Coffee Machines
- Credit Cards
- Energy Drinks
- Fabric Softeners
- Facial Moisturizers for Women
- Facial Tissue
- Fitness Trackers
- Frozen Entrees
- Hair Coloring (Women)
- Hair Coloring (Men)
- Hair Dryers
- Home/Renters Insurance
- Hotels
- Ice Cream
- Kitchen Cleaners
- Laptop Computers
- Laundry Detergent
- Life Insurance
- Light Beer
- Liquid Hand Soap
- Mayonnaise
- Microwave Ovens
- Microwave Popcorn
- Mouthwash
- Online Movies/TV/Video Streaming Services
- Orange Juice
- Packaged Coffee
- Personal Computers
- Products from a Big Box Retailer
- Quick Serve Restaurants
- Salty Snacks
- Sedans
- Smart Watches
- Smartphones
- Streaming Media Players
- Tablet Computers
- Tea
- Televisions
- Trucks
- Yogurt
If you see some data you would like to see expanded upon, please send us a note at sales@thebrandstrengthmonitor.com.
Thank you for reading and we will continue to release maps for new categories as the 2016
US Presidential Election approaches.