
It is difficult to watch or read the news without hearing about political divisions in the US. Whether
they’re talking Democrats, Republicans, Libertarians, or the Green Party, there seems to be a lot
of disagreement out there. However, we here at MSW●ARS Research have discovered factions you
may not have even known existed until now – with consumer categories. As a fun repurposing of the
data we collect using our Brand Strength Monitor platform, we are getting to the bottom of
this – one category at a time.
Throughout the 2016 US Presidential Election season we’re sharing some “voting” results. Instead of the
traditional red state/blue state/swing state format, we’re looking at “voting” results for some of
the more than 60 categories on The Brand Strength Monitor Dashboard to determine which brand would
win an election versus its category competitors.
Instead of simply looking at the “popular vote” across thousands of respondents, we decided it would
be a lot of fun to look at results by state Electoral College votes – similar to how the US actually
elects its president every four years.
Thus far, we have included maps for the following categories:
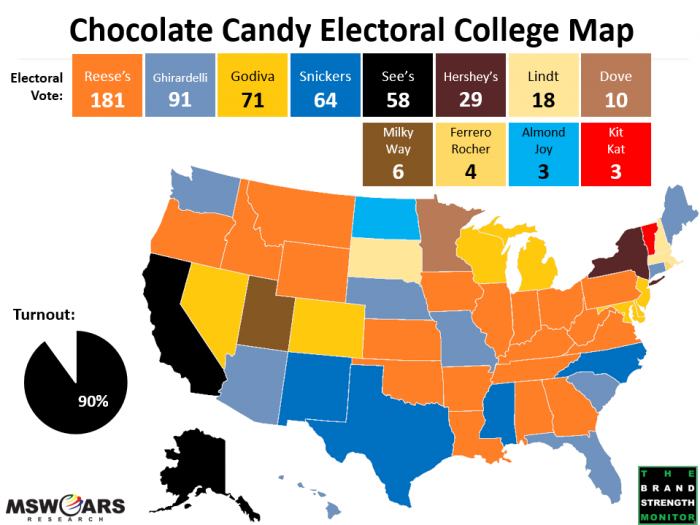
In the spirit of Halloween, this week’s category is Chocolate Candy.
Before we get started with the electoral map, take a look at the gender gap in this category:
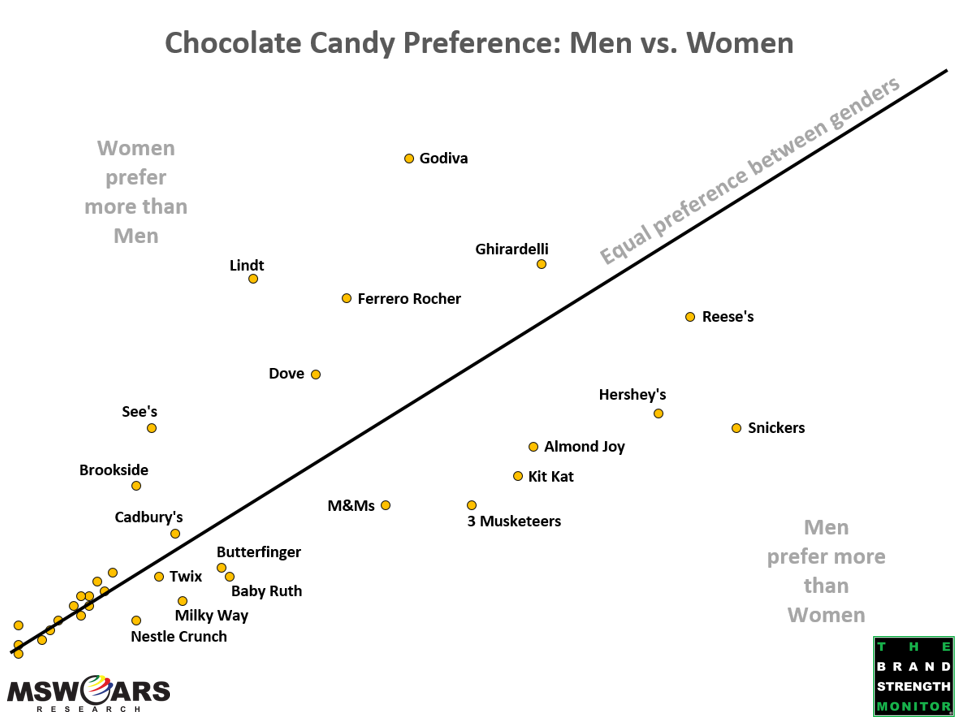
You have probably heard this one before in the 2016 Election season: Men and Women have very different preferences…
Women prefer premium brands such as Godiva and Ghirardelli, but Men tend to prefer brands with lower price points such as Reese’s and Snickers. We should point out that respondents of both genders were given the same list of brands to choose from, and there were no economic incentives or disincentives offered to lead them to prefer or not prefer one product price tier over another. In other words: this gender gap is legit and money is no determining factor – unless you believe Men just find a lower costing chocolate candy that much more satisfying (and you may be onto something there).
So, not only is this category an interesting one for Halloween, but its gender gap makes it quite fitting for the 2016 Presidential Election too (and probably Valentine’s Day).

Reese’s leads the way with 181 electoral votes and wins in 19 different states.
- Their wins stretch from coast to coast with victories in large states like Pennsylvania and Illinois (20 electoral votes a piece).
- They are exceptionally strong in the eastern half of the map with a large collection of states in the Midwest and South, which helps them rack up the highest total.
- Opportunities for them include not being able to seal the deal in some of the largest states, including California, New York, Florida, and Texas. Lucky for them, four different brands split those four states to keep any closely trailing brands from coming too close overall.
Ghirardelli secures second place with 91 electoral votes and wins in nine states.
- They are able to scatter wins across the country with their biggest coming in Florida and earning them those 29 electoral votes.
- Washington, Arizona, and Missouri also help their numbers.
Godiva comes in third place with 71 electoral votes and wins in seven states plus Washington D.C.
- A few different regions show groups of wins for Godiva:
- The West yields Nevada and Colorado.
- The upper Midwest brings Michigan and Wisconsin.
- The Mid-Atlantic nets Maryland, New Jersey, Delaware, and D.C.
Snickers places fourth with 64 electoral votes and wins in four different states.
- With those kinds of numbers, you know they must be making the most of their wins with Texas (38 electoral votes) and North Carolina (15).
See’s Candies breaks through with fifth place via two wins netting them 58 electoral votes.
- This brand gets the job done in their home state of California (headquartered in the Bay Area) by quite a large margin given this category’s dynamics. In particular, as you can probably assume from our gender gap graphic, they do very well with Women in that state.
Hershey’s is next and though they only come away with one win – it is the state of New York and their 29 electoral votes.
Lindt is the seventh place brand and the final one to win in multiple states: New Hampshire and Massachusetts in New England as well as South Dakota.
The rest of the brands are able to get on the board with one win a piece:
- Dove – Minnesota
- Milky Way – Utah
- Ferrero Rocher – Rhode Island
- Almond Joy – North Dakota
- Kit Kat – Vermont
The brands included in the Chocolate Candy exercise include:
- Reese’s
- Godiva
- Ghirardelli
- Snickers
- Hershey’s
- Almond Joy
- Ferrero Rocher
- Lindt
- Kit Kat
- Dove
- 3 Musketeers
- M&Ms
- See’s Candies
- Brookside
- Butterfinger
- Baby Ruth
- Cadbury’s
- Twix
- Milky Way
- York
- Russel Stover
- Toblerone
- Nestle Crunch
- Mounds
- Other
- Roca
- Whitmans
- Baci Perugina
- Ce Moi
- Rolo
- Mars
- Merci
- Sanders
- Palmer
MSW●ARS is already tracking this data for the following categories. Let us know if you see
one you are interested in, or if you would like us to begin tracking your category:
- Antiperspirants/Deodorants (Women)
- Antiperspirants/Deodorants (Men)
- Analgesics, Internal
- Athletic Shoes (Women)
- Athletic Shoes (Men)
- Auto Insurance
- Bank Services
- Bar Soap
- Bathroom Tissue
- Bleach or Laundry Whiteners
- Blue Jeans (Women)
- Blue Jeans (Men)
- Body Lotions (Women)
- Body Lotions (Men)
- Bottled Water
- Breakfast Bars
- Cable or Satellite TV Subscriptions
- Caramel/Toffee Snacks
- Casual Dining Restaurants
- Cell Phone Carriers
- Chewing Gum
- Chocolate Candy
- Cloud Data Storage
- Coffee Machines
- Credit Cards
- Energy Drinks
- Fabric Softeners
- Facial Moisturizers for Women
- Facial Tissue
- Fitness Trackers
- Frozen Entrees
- Hair Coloring (Women)
- Hair Coloring (Men)
- Hair Dryers
- Home/Renters Insurance
- Hotels
- Ice Cream
- Kitchen Cleaners
- Laptop Computers
- Laundry Detergent
- Life Insurance
- Light Beer
- Liquid Hand Soap
- Mayonnaise
- Microwave Ovens
- Microwave Popcorn
- Mouthwash
- Online Movies/TV/Video Streaming Services
- Orange Juice
- Packaged Coffee
- Personal Computers
- Products from a Big Box Retailer
- Quick Serve Restaurants
- Salty Snacks
- Sedans
- Smart Watches
- Smartphones
- Streaming Media Players
- Tablet Computers
- Tea
- Televisions
- Trucks
- Yogurt
If you see some data you would like to see expanded upon, please send us a note at sales@thebrandstrengthmonitor.com.
Thank you for reading and we will continue to release maps for new categories as the 2016
US Presidential Election approaches.