

It is difficult to watch or read the news without hearing about political divisions in the US. Whether
they’re talking Democrats, Republicans, Libertarians, or the Green Party, there seems to be a lot
of disagreement out there. However, we here at MSW●ARS Research have discovered factions you
may not have even known existed until now – with consumer categories. As a fun repurposing of the
data we collect using our Brand Strength Monitor platform, we are getting to the bottom of
this – one category at a time.
Throughout the 2016 US Presidential Election season we’re sharing some “voting” results. Instead of the
traditional red state/blue state/swing state format, we’re looking at “voting” results for some of
the more than 60 categories on The Brand Strength Monitor Dashboard to determine which brand would
win an election versus its category competitors.
Instead of simply looking at the “popular vote” across thousands of respondents, we decided it would
be a lot of fun to look at results by state Electoral College votes – similar to how the US actually
elects its president every four years.
Thus far, we have included maps for the following categories:
This week’s category is Mayonnaise products.
As we saw with the Bottled Water map from earlier in the year, regional distribution can result in one large company having different brand names in different parts of the country for very similar products. The Mayonnaise category definitely has that going on with two of the leading brands both being owned by Unilever and sharing the same product packaging cues.
But even with this overlap, there is much more to the regional story for this category and we will use our Brand Strength Monitor data to examine just what this looks like across the 50 states plus D.C.
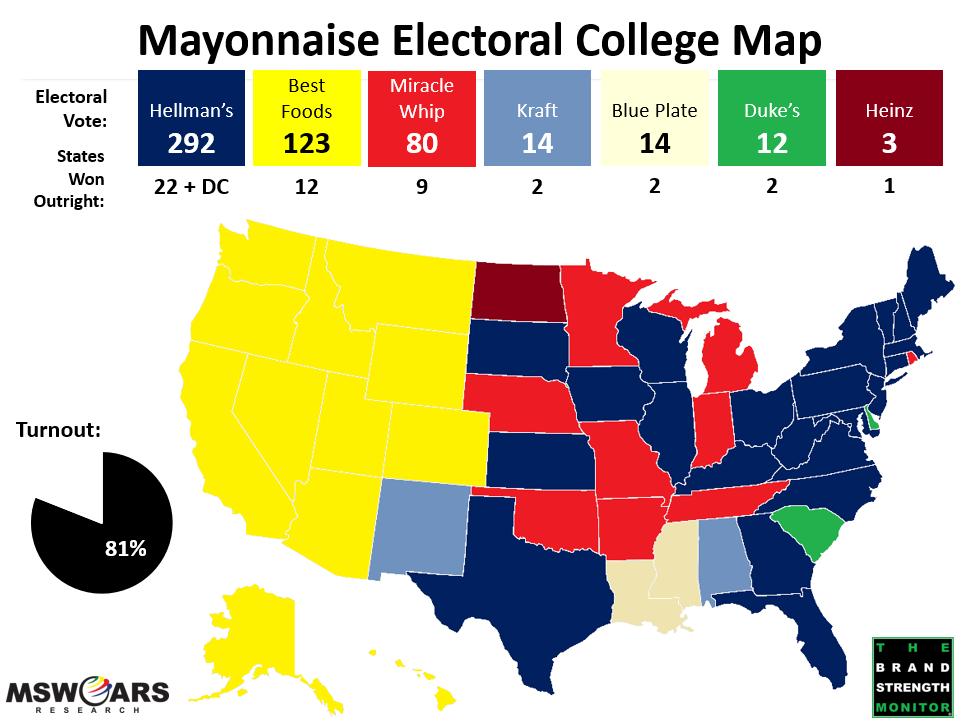
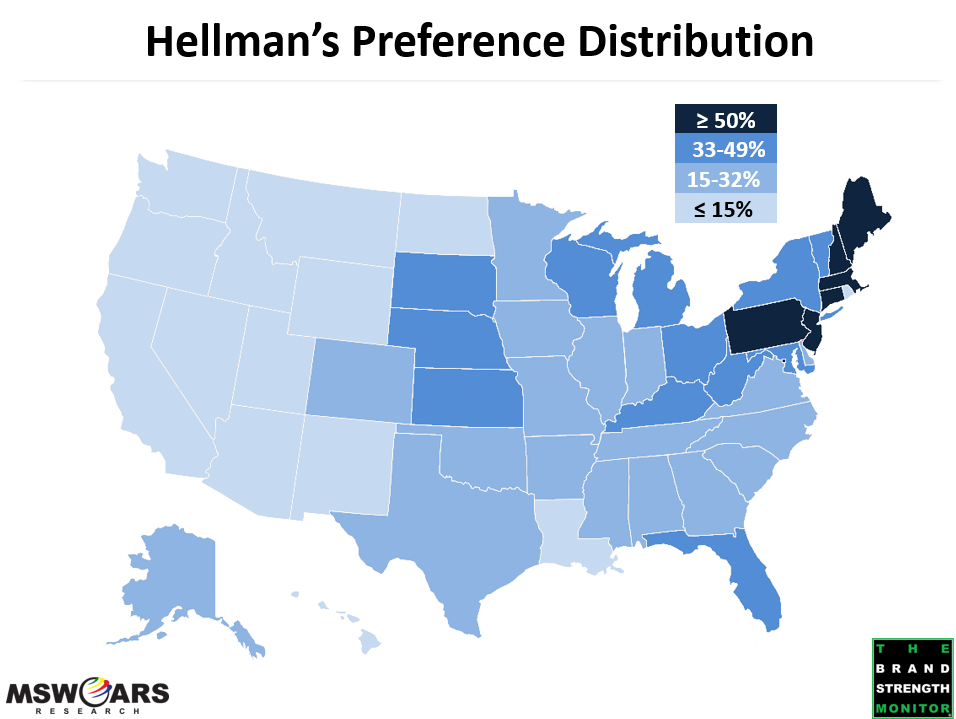
On the surface, it may not look like much of a competition – Hellman’s wins 292 electoral votes and eclipses the 270 threshold, which means they “win” the presidency. They win nearly half of the states and the closest competitor is more than 150 electoral votes behind.
- However, unlike other categories where the winner generally has at least decent showings across the map, the regionality/distribution of this particular category may result in internal unrest (some people have very vocal mayo preferences) as Hellman’s is virtually a non-player west of the Rockies and struggles to dominate in the Midwest and South at the same levels it does in the Northeast.
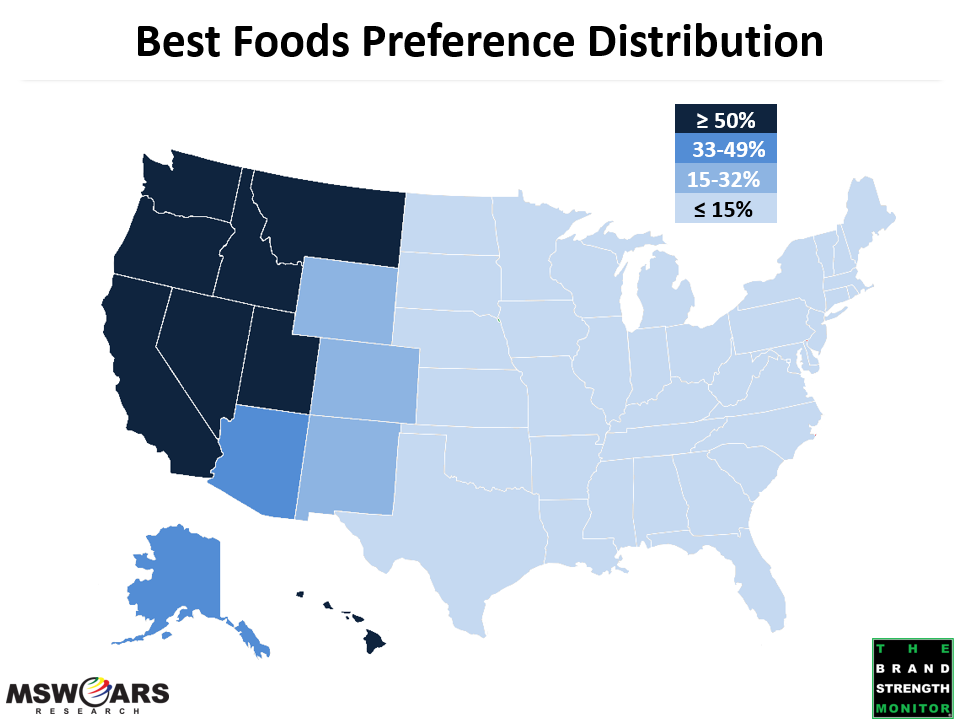
The big reason for the lack of a Hellman’s presence in the West is our #2 brand, Best Foods. They take a large contiguous group of western states that includes California, Washington, Arizona, and Colorado, which allow them to reach 123 electoral votes.
- As we hinted in the intro, Hellman’s and Best Foods are both owned by the same company and share very similar packaging cues. While many claim there is no difference between the two other than their distribution, others swear there is a difference.
- Regardless of their similarities (or lack thereof), it is remarkable to see such an abrupt change in brand preference between neighboring regions of the country. Best Foods dominates west of the Rockies, but their support abruptly drops off after you cross the Rocky Mountains as they do not garner much support east of Colorado due to their distribution.
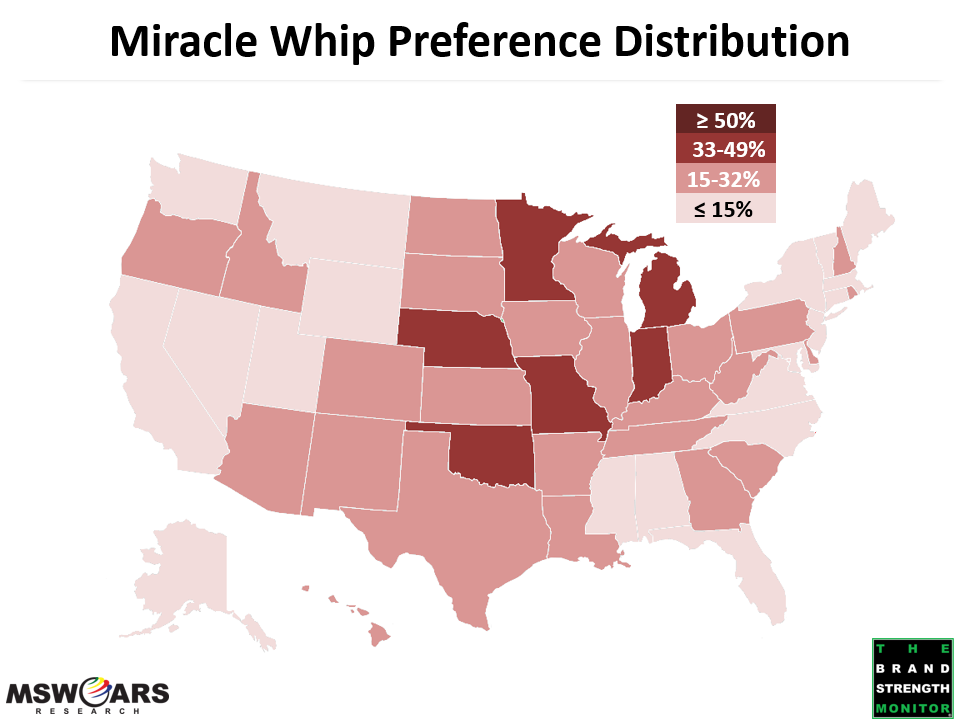
While Hellman’s and Best Foods have strongholds on the East and West ends of the country, respectively, Miracle Whip grabs enough states in the central part of the nation to reach third place with 80 electoral votes.
- They have fans across the country, though they get fewer in number as you get closer to each coast. Miracle Whip has a tough time beating Hellman’s and Best Foods in their strongholds, though they can take solace in that they are able to exceed 15% on each coast in states like Oregon and Hawaii in the West and Georgia and Pennsylvania in the East – a feat that not even the two leaders can claim.
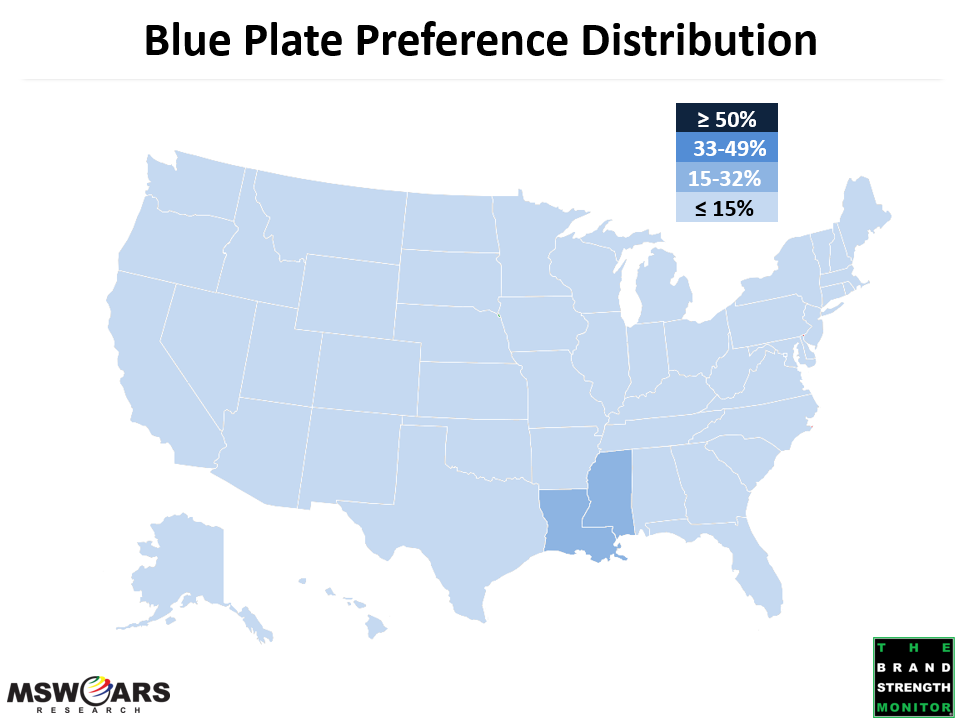
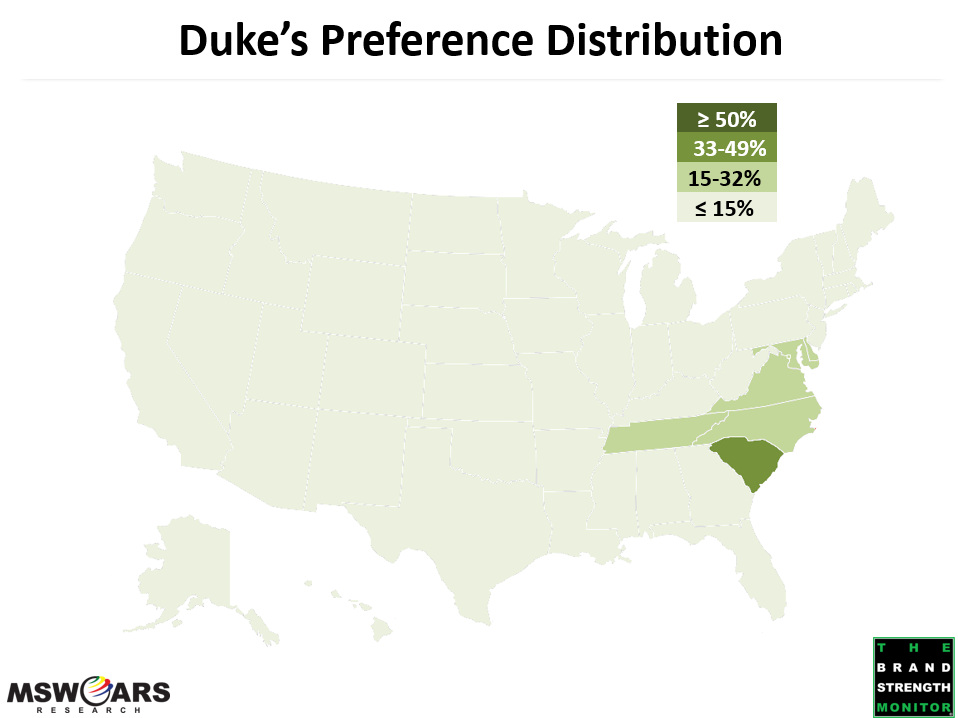
The next group of brands are even more regional than the three aforementioned brands (believe it or not). They each take home two different states and win between 12 and 14 electoral votes. The Achilles heel for each is that while they do well in their strongholds, they have very little support elsewhere.
- Blue Plate wins Louisiana and Mississippi in the South, but does not achieve greater than 15% in any other state.
- Duke’s is a big player especially in the Mid-Atlantic and Carolinas while winning South Carolina and Delaware (almost North Carolina), but their support does not extend beyond these areas much, with the exception of neighboring Tennessee.
The next two are major national brands that are more known for their presences in other food/condiment categories than Mayonnaise. Their support is wide, but they are usually “also-rans” in most states.
- Kraft (note that this is separate from Miracle Whip) takes Alabama and New Mexico to achieve 14 electoral votes.
- Heinz is able to win North Dakota and its three electoral votes.
The brands included in the Mayonnaise exercise are:
- Hellman’s
- Miracle Whip
- Best Foods
- Kraft
- Heinz
- Duke’s
- Smart Balance
- Goya
- Other
- Blue Plate
- Bama
- Kewpie
MSW●ARS is already tracking this data for the following categories. Let us know if you see
one you are interested in, or if you would like us to begin tracking your category:
- Antiperspirants/Deodorants (Women)
- Antiperspirants/Deodorants (Men)
- Analgesics, Internal
- Athletic Shoes (Women)
- Athletic Shoes (Men)
- Auto Insurance
- Bank Services
- Bar Soap
- Bathroom Tissue
- Bleach or Laundry Whiteners
- Blue Jeans (Women)
- Blue Jeans (Men)
- Body Lotions (Women)
- Body Lotions (Men)
- Bottled Water
- Breakfast Bars
- Cable or Satellite TV Subscriptions
- Caramel/Toffee Snacks
- Casual Dining Restaurants
- Cell Phone Carriers
- Chewing Gum
- Chocolate Candy
- Cloud Data Storage
- Coffee Machines
- Credit Cards
- Energy Drinks
- Fabric Softeners
- Facial Moisturizers for Women
- Facial Tissue
- Fitness Trackers
- Frozen Entrees
- Hair Coloring (Women)
- Hair Coloring (Men)
- Hair Dryers
- Home/Renters Insurance
- Hotels
- Ice Cream
- Kitchen Cleaners
- Laptop Computers
- Laundry Detergent
- Life Insurance
- Light Beer
- Liquid Hand Soap
- Mayonnaise
- Microwave Ovens
- Microwave Popcorn
- Mouthwash
- Online Movies/TV/Video Streaming Services
- Orange Juice
- Packaged Coffee
- Personal Computers
- Products from a Big Box Retailer
- Quick Serve Restaurants
- Salty Snacks
- Sedans
- Smart Watches
- Smartphones
- Streaming Media Players
- Tablet Computers
- Tea
- Televisions
- Trucks
- Yogurt
If you see some data you would like to see expanded upon, please send us a note at sales@thebrandstrengthmonitor.com.
Thank you for reading and we will continue to release maps for new categories as the 2016
US Presidential Election approaches.