
There’s a lot of dissatisfaction in the research community with trackers. We hear things like; “too big”, “bloated”, “measuring too much”, “too expensive”, “not actionable”, etc. This isn’t new but it seems to be at a fever pitch recently. As such we’ve been fielding a lot of questions about what we recommend as best practices. I suspect this is a topic that we’ll be addressing more in the coming months but let’s start with this to get the conversation off on the right foot as to what we here at MSW●ARS believe to be the best in class approach. Most of this can be found in a paper that our own Frank Findley, EVP of Research presented at the ARF Re!Think Conference this year. (contact us for the full paper) In it we present what is considered by thought leaders in our industry to be the best practices:
- Utilize one primary aggregate measure. The best in class choice for this measure is our Brand Preference. This is supported by many independently validated research projects, most recently the MASB work presented in this paper. The three most important features of this measure are its ability to capture the impact of all other ‘equity’ measures, take into account competitors and provide data collection at the individual respondent level. Brand Preference is the cornerstone measure of our Brand Strength Monitor service.
- Once you’ve established this, you should use the other 7 measures that we typically see work across all categories to help explain the data. They are: Awareness Unaided, Brand Loyalty, Value, Purchase Intent, Brand Relevance, Awareness Aided and Advocacy.
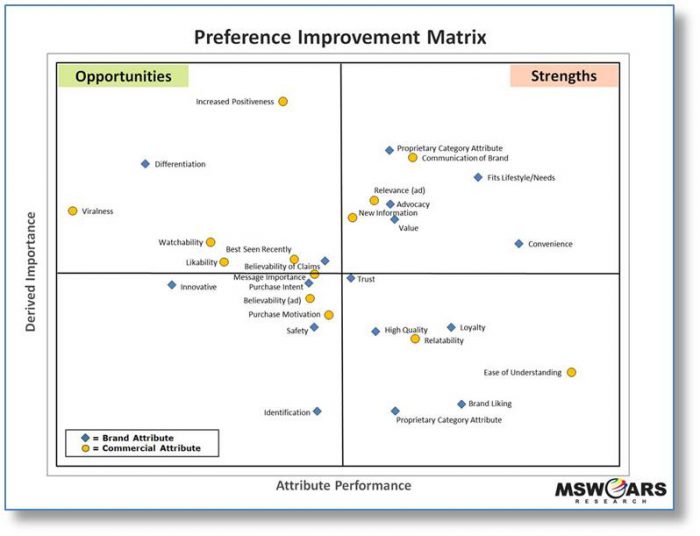
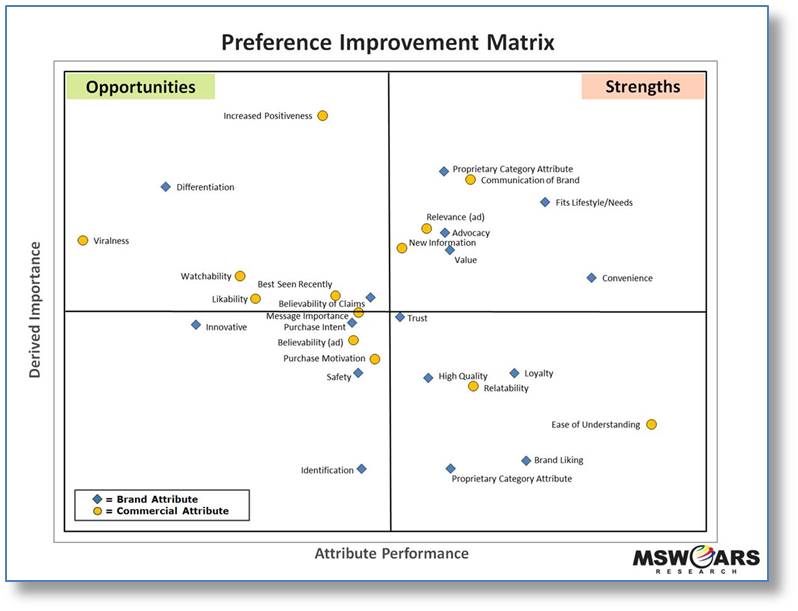
- Then what we do for clients is customize their trackers to address specific category needs. For example, convenience might be an important measure for one category but not another. To gauge this, each element can be analytically compared versus the aggregate measure to calculate a derived importance. The strengths and opportunities for the brand can then be easily found by crossing derived importance versus brand performance on the attributes (see matrix example below). This type of analytics is usually done once per year or every two years as category drivers tend to be steady in the absence of disruptive changes in the category.
- Collectively the brand preference, the seven cross-category measures, and the category specific measures can be arranged into a score card and tracked over time. Currently 70% of our clients collect this data continuously while 30% do waves (typically two per year). For those that collect it continuously, the data itself is typically rolled up monthly with ‘deep dive’ reports going to management quarterly.
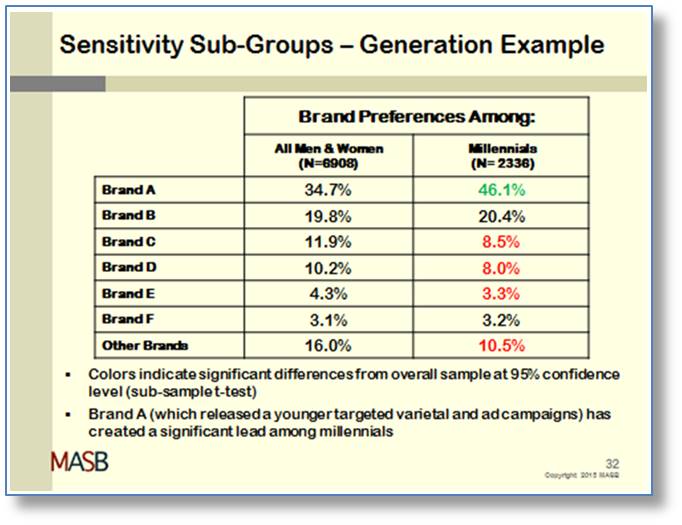
- Along with the scorecard, there are also generally segmentation type analyses where performance on KPIs is used to find and qualify consumer clusters or to monitor trends on quickly growing consumer groups. For example, monitoring millennials has become standard. This chart from the MASB, Brand Investment & Valuation Project demonstrates this point:
So, if you’re like many that we’re hearing from recently, and those with whom we’ve already shared this thinking with, this may be a revelation. If you’d like to read more about this, please contact us – we’re happy to share a full white paper with you and we can discuss your particular needs.