

If you are a sports fan, then chances are you are aware that this is quite an exciting time of the year for College Football. With all the talk of rivalries, advantages, disadvantages, and strategies, it made us here at MSW-ARS think: What if top brands played in bowl games? How would those matchups look?
Using our 2016 Brand Strength Monitor data (TBSM), we did just that, and we will be sharing these throughout the month.
To date, we have taken a look at the following “matchups”:
|
Week 1: |
Week 2: |
This week, we are going to continue picking out some of the biggest “rivalries” based on our TBSM data.
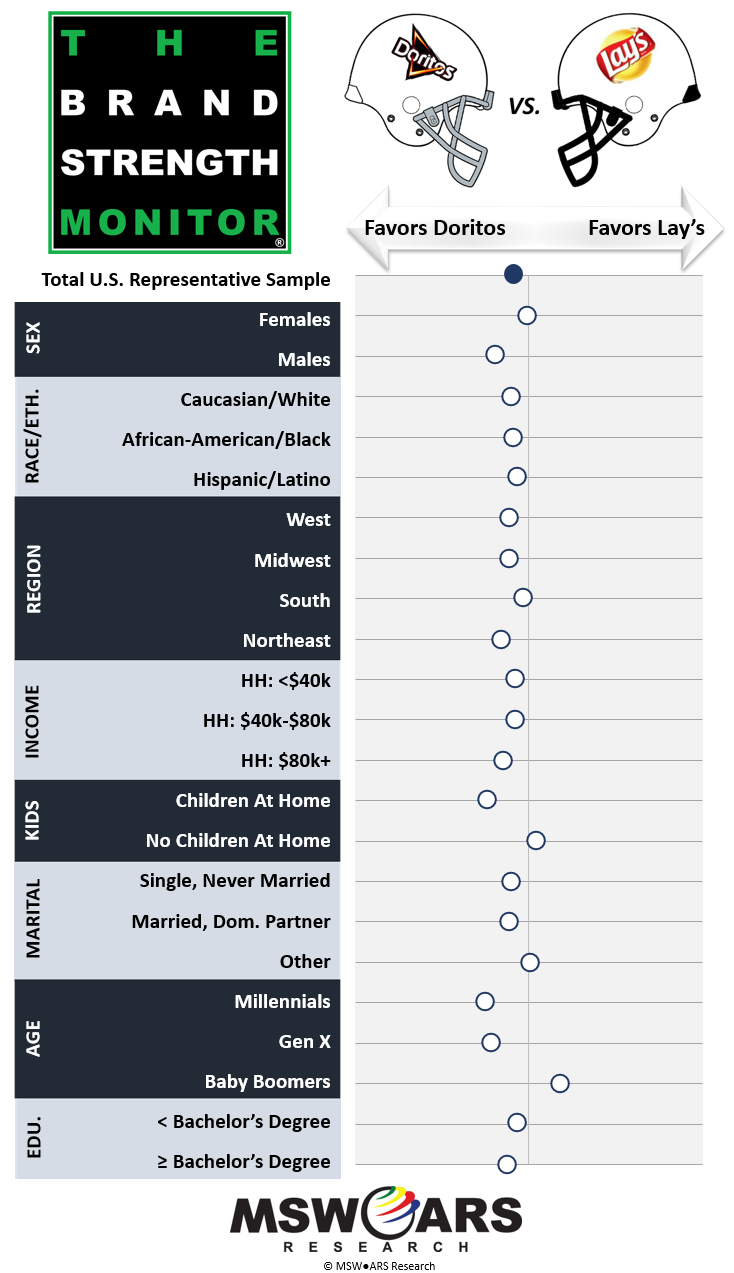
First, we will take a look at a category sure to be on the forefront of many consumers’ minds (and coffee tables) for the remainder of bowl season, the NFL playoffs, and the Super Bowl: Salty Snacks. Two of the biggest chip brands in this category are Doritos and Lay’s.
|
|
As you can see, Doritos has a slight advantage in this matchup due to their strengths with younger consumers (Millennials and Gen X) as well as Males. Lay’s is keeping it close with their Baby Boomer numbers, though no other demographic shows a strong advantage for them. It is, however, promising for Lay’s that the matchups among Females (worth mentioning they are roughly half of the sample) and Southerners are very much toss-ups. |
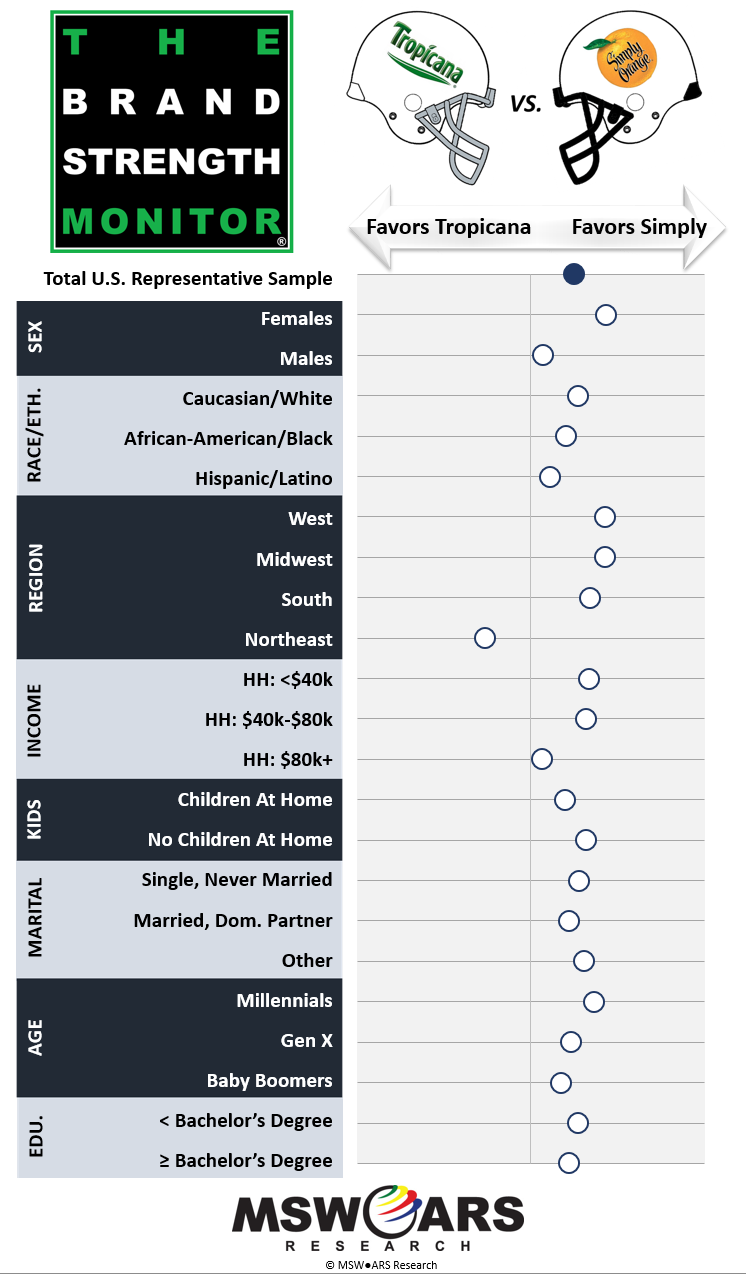
With bowl names like “Orange Bowl” (and “Citrus Bowl” and others) coming up, naturally, one may think of the Orange Juice category and its two heavyweights: Tropicana and Simply Orange.
|
|
When we compare the numbers for these two brands, it is clear that Simply Orange has the advantage in a hypothetical matchup. Tropicana’s only advantage is with Northeasterners – and it is quite a sizable one. They keep it relatively close with Males, older, and higher income consumers, though it is tough to match Simply Orange’s advantages with younger Females in all non-Northeastern regions. |
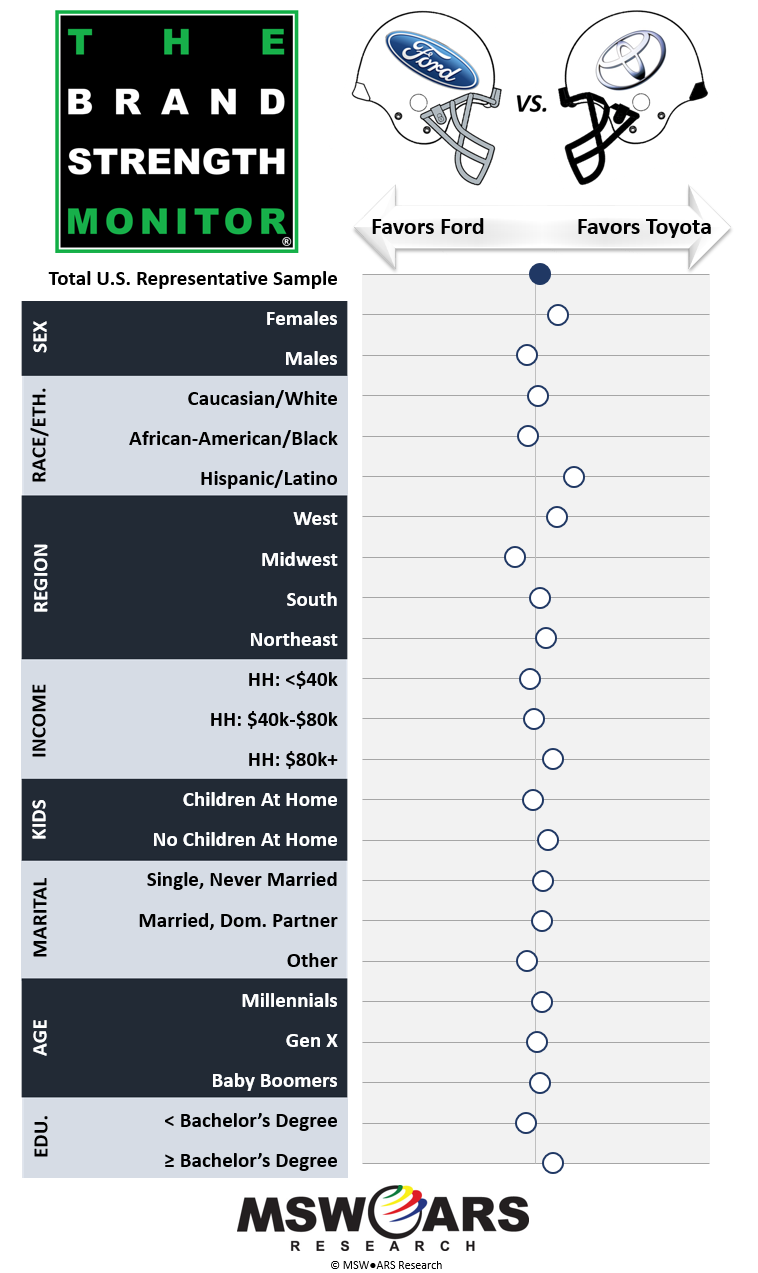
Car commercials are never too far away from any big sporting event, so we thought we would go ahead and take a look at the sedan rivalry between two heavyweights: Ford vs. Toyota.
| This matchup is extremely close with just about every demographic, though some breakthrough as being more favorable to one over the other. For instance, Females tend to favor Toyota while Males tend to go with Ford. Midwestern consumers (where Detroit is located) favor Ford, though the other three major regions all trend toward Toyota. Income and Education both exhibit some trends too – as they increase, Toyota is favored more. Last but not least, Toyota appears to have a large advantage with Hispanic/Latino consumers – and given how close the overall matchup is, this discrepancy between the two could make all of the difference.
|
|
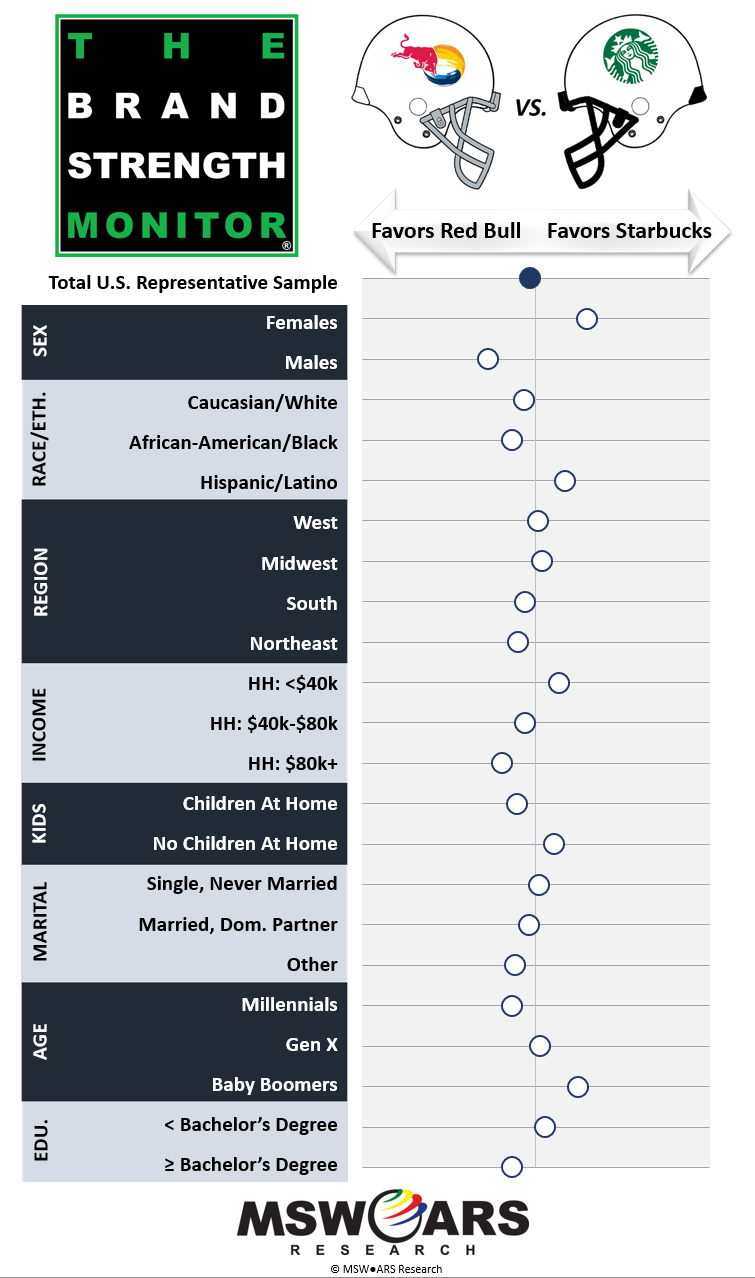
Every year they seem to add more bowl games, and with these extra games comes the need to keep up the energy for what is sometimes several games in a single day – and if you are staying up for New Year’s Eve, then that just adds to it. This may lead to the need for Energy Drinks, which are involved in our final matchup this week: Red Bull vs. Starbucks. In this instance, we are talking about Starbucks Energy Drink offerings and not necessarily the coffee from your corner store.
| Especially in recent years, Starbucks has made quite an impact in the Energy Drink category and is very much right up there with category stalwart Red Bull in terms of overall brand preference (slightly trailing). However, the rise of Starbucks in this category may not be due to demographics you would expect – they actually have the advantage with Non-Millennials as opposed to Millennials. Red Bull, on the other hand, is stronger with Millennials, which are currently disproportionately large in this still-up-and-coming category. While age is an important component in this matchup, it is hard to look past the gender gap between these two brands – Red Bull has a large advantage with Males while Starbucks is most popular among Females. We here at MSW-ARS will definitely be monitoring this dynamic category closely in the months to come.
|
|
That is it for this week, but we will be back with more matchups before the end of the bowl season.
If you would like to know more regarding the data and platform used here, then please contact us at sales@thebrandstrengthmonitor.com
Our TBSM metric is the ONLY Independently Validated Measure of Brand Value.
Thank you very much for reading and we hope you enjoy future weeks’ blogs as well as the actual bowl games!