

It is no secret that Amazon and Walmart are challenging each other left and right lately for big box retailer supremacy. There have been plenty of interesting articles talking of the “collision course” they are on. There have been others with great points regarding how they want to become more like the other soon.
There is no doubting the validity of the points made in these articles. However, it got us thinking: How much do these two companies already compete?
Fortunately, we here at MSW-ARS Research are in a unique position to easily answer these questions and more using our The Brand Strength Monitor (TBSM) brand preference data and platform. Some quick background on our measure: It is the only independently validated measure of brand value. In order to gain this distinction the MSW●ARS Brand Preference Metric had to meet the MASB Marketing Metric Audit Protocol (MMAP) and the 10 characteristics cited of an “Ideal Metric,” which stipulate that the measure must be:
- Relevant
- Predictive
- Objective
- Calibrated
- Reliable
- Sensitive
- Simple
- Causal
- Transparent
- Quality Assured
The MSW●ARS Brand Preference measure has been widely available for many years within our research techniques. Now we have taken our approach to Brand Preference and launched TBSM, a game-changing deliverable of this established, trusted and independently validated measure of brand value. All of the data we are about to discuss is easily accessible via the online platform, which includes thousands of possible data splits:
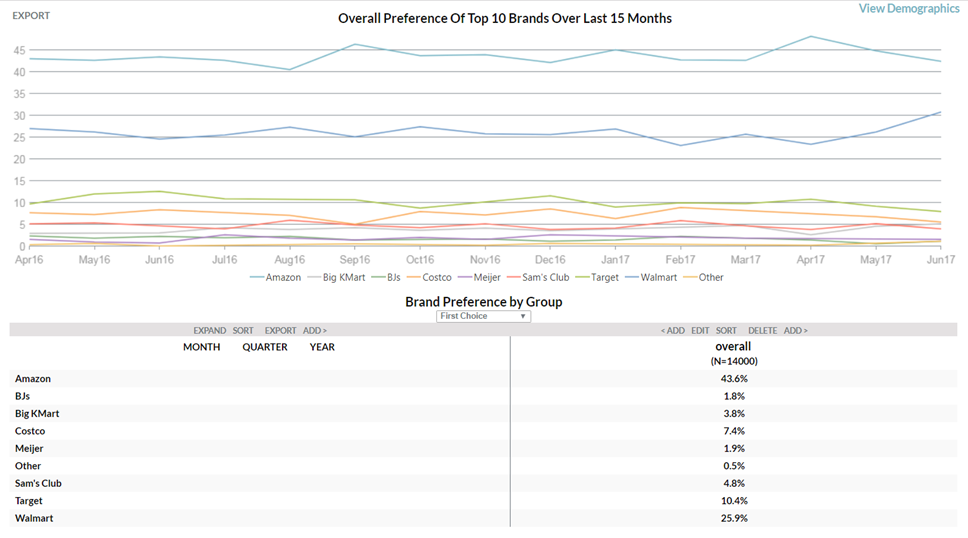
One of the dozens of categories we have been tracking throughout the past year is big box retailers. Using that data, we can learn a lot about this Amazon/Walmart battle.
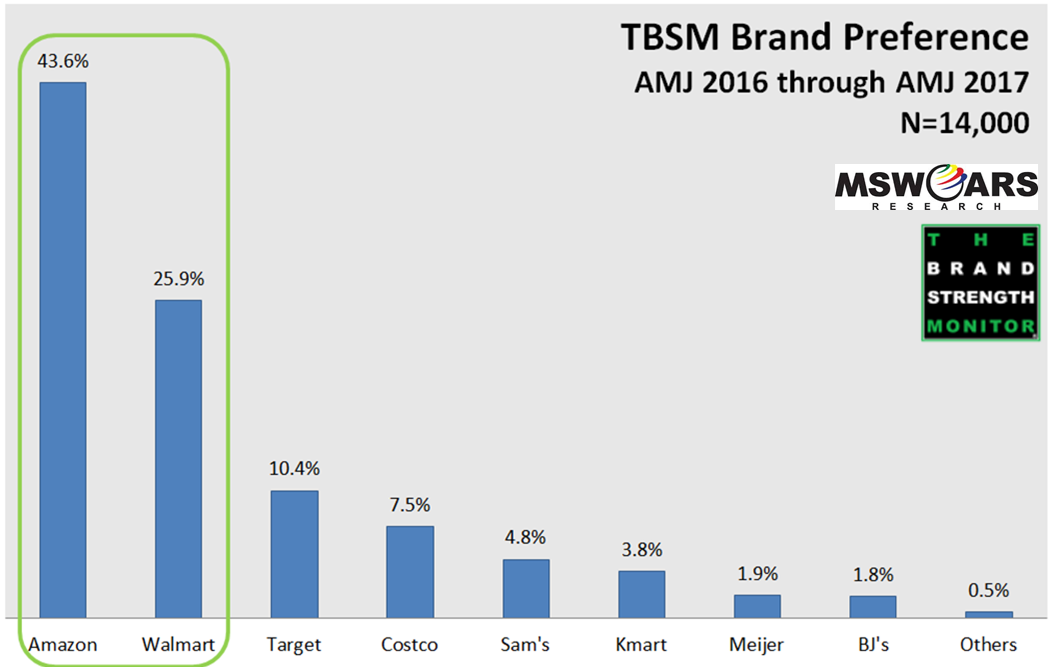
First, it is important to realize the strides Amazon has made. For a company that was just getting off the ground 20 years ago, they are currently leading the field in brand preference – and it really is not that close with the overall sample, which is balanced to Census (N=14,000 since AMJ 2016). Walmart is in a respectable second place versus the rest of the bunch, but trails Amazon by a wide margin.
Based on this data, one might assume Amazon and Walmart compete over a lot of the same consumers and have similar preference trends since they are #1 and #2, respectively. However, our data indicates that might not be completely true. Oftentimes, Amazon’s demographic strengths are Walmart’s opportunities – and vice versa.
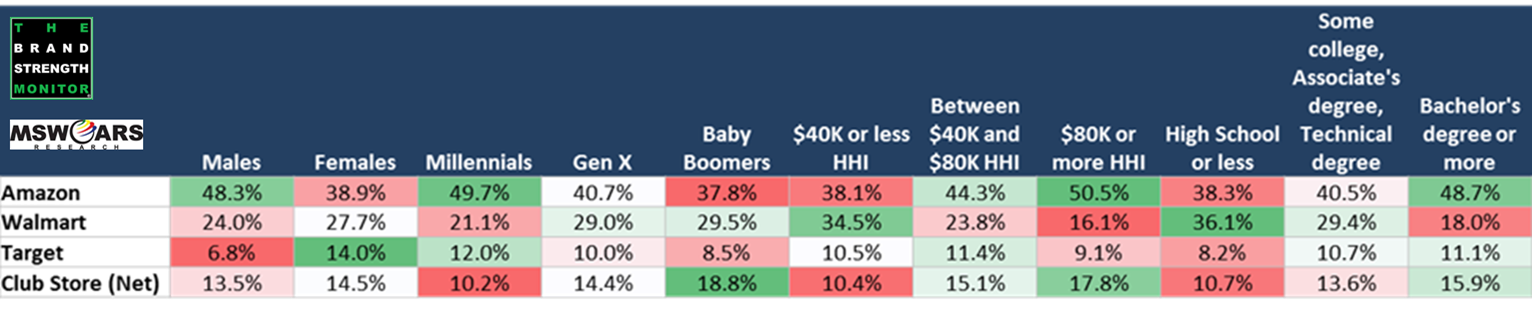
Amazon has their largest strengths among the following groups:
- Higher income consumers ($80K+ annual household income)
- Millennials (ages 18 to 36)
- Consumers with higher education levels (Bachelor’s Degree and above)
- Males
Meanwhile, Walmart has their preference driven by:
- Consumers with a High School diploma or less
- Lower income consumers ($40K or less annual household income)
- Baby Boomers (ages 52 and above)
The same holds true when we look across the country as well. For the most part, Walmart’s strongest states are Amazon’s weakest – and vice versa.
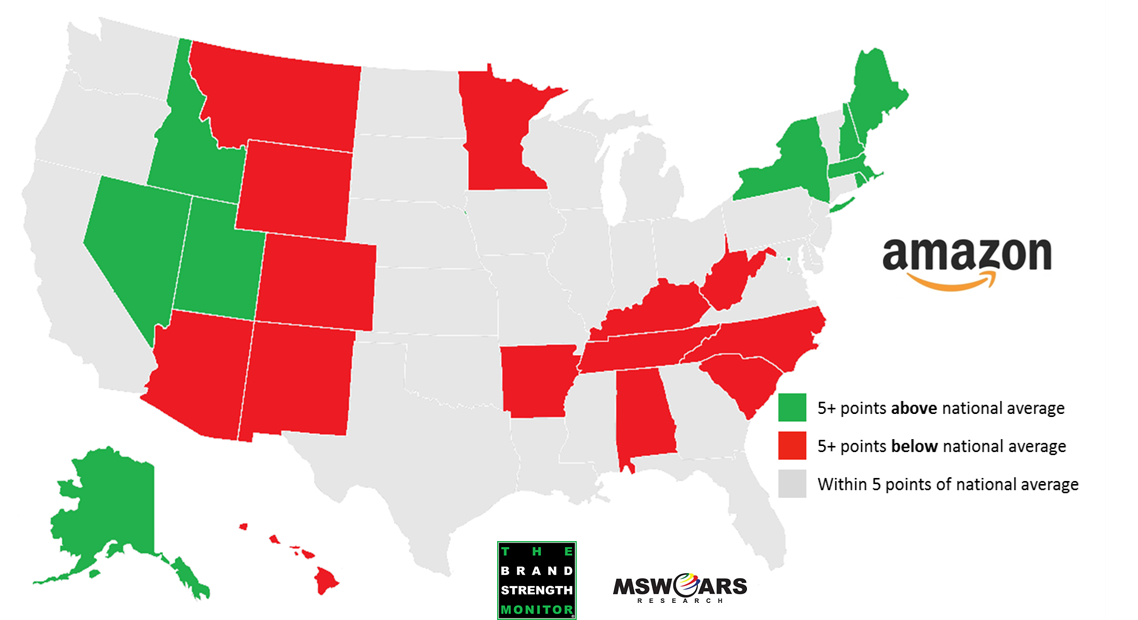
Amazon has definite strengths in New York and New England – as well as some western states. Amazon’s opportunities come primary in the South and rural interior West. Minnesota is not a strong state for Amazon, but that has more to do with Target (founded there) than Walmart. Many larger states such as California, Texas, Florida, and Illinois are gray, which means they go along with the national trend, which is a good thing for a company like Amazon with high national preference numbers.
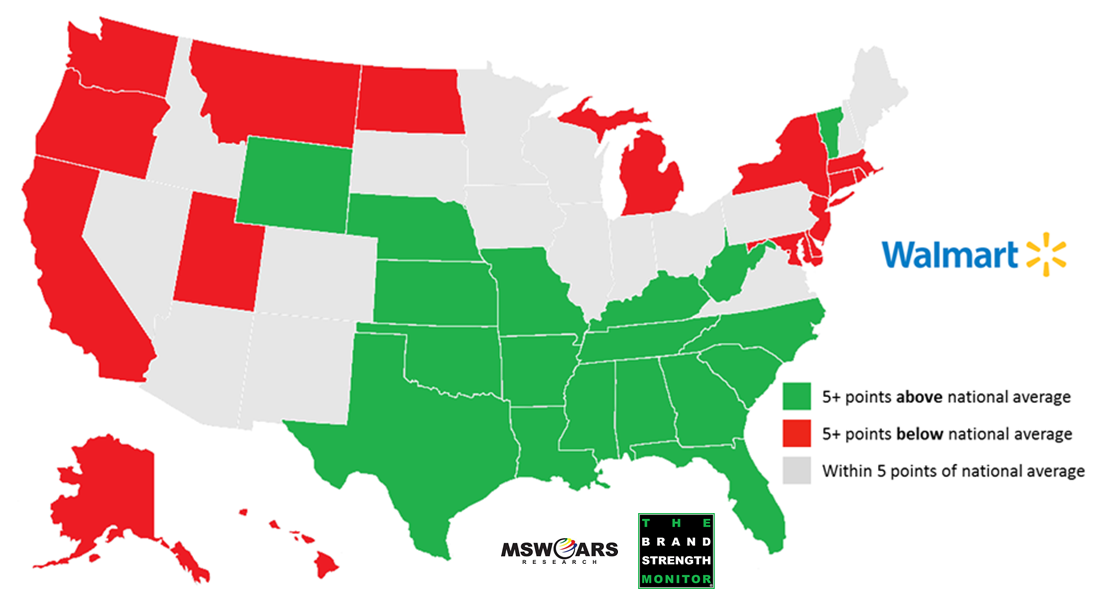
Walmart, which was founded in Arkansas, has their strengths in southern states as well as parts of the rural Midwest. You can tell from the map that there is a lot more polarization with Walmart than with Amazon – that is, most states are either green or red. Some regions are almost entirely red, including the West coast as well as the Northeast.
What does this all mean? Amazon and Walmart’s attempts to one-up each other may make for great news stories and they probably are able to erode the other’s standing somewhat with each move. However, they definitely each have their demographic (and geographic) strongholds that will be especially difficult for the other to seize. It is not as if they are both driven by similar groups of consumers and this is a simple game of tug-of-war.
Amazon can point to their strength among younger consumers as reason for optimism for the future. Walmart has longevity on their side in addition to regional appeal with some of the fastest growing states in the Sunbelt.
Perhaps one of these two will ultimately decisively prevail while the other fades. In the meantime, with each punch and counterpunch, consumers appear to be the ones reaping the most from this competition as they tend to be getting lower prices and higher quality service.
If you like what you see here for Amazon and Walmart, and would like to explore the data further – or for other categories, feel free to reach out to us at sales@thebrandstrengthmonitor.com. We have been tracking 60+ categories since the beginning of 2016 and would love to begin tracking other categories you are interested in as well.
The MSW●ARS Brand Preference measure is prominently featured in our copy testing as well, which is also strongly correlated to MMM. We are more than happy to discuss those options with you as well.
Thank you for reading!