
In this blog series, we’ve shared insights from The Brand Strength Monitor (TBSM) data, and focused on the biggest winners and losers from Q1 2016 to Q1 2017, including causes as well as implications for their respective categories.
Thus far, we have looked individually at many brands seeing gains and losses versus Q1 2016 levels. This week, we are going to do the same, but with a group of brands instead.
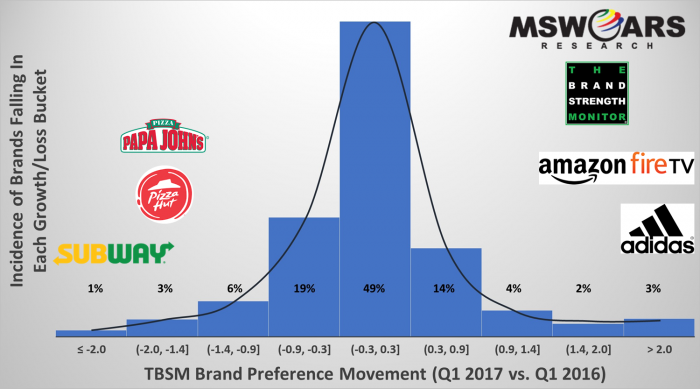
Before we discuss this week’s brands, we’d like to remind you just how difficult it is for a brand to move our brand preference needle (like actual market share itself). It does not overreact by showing changes that are not happening in market. In fact, as the following bell curve shows, about half of the 750+ brands tracked during Q1 2016 and Q1 2017 see essentially no change (±0.3). Over 80% of the brands we track see a change of a point or less.
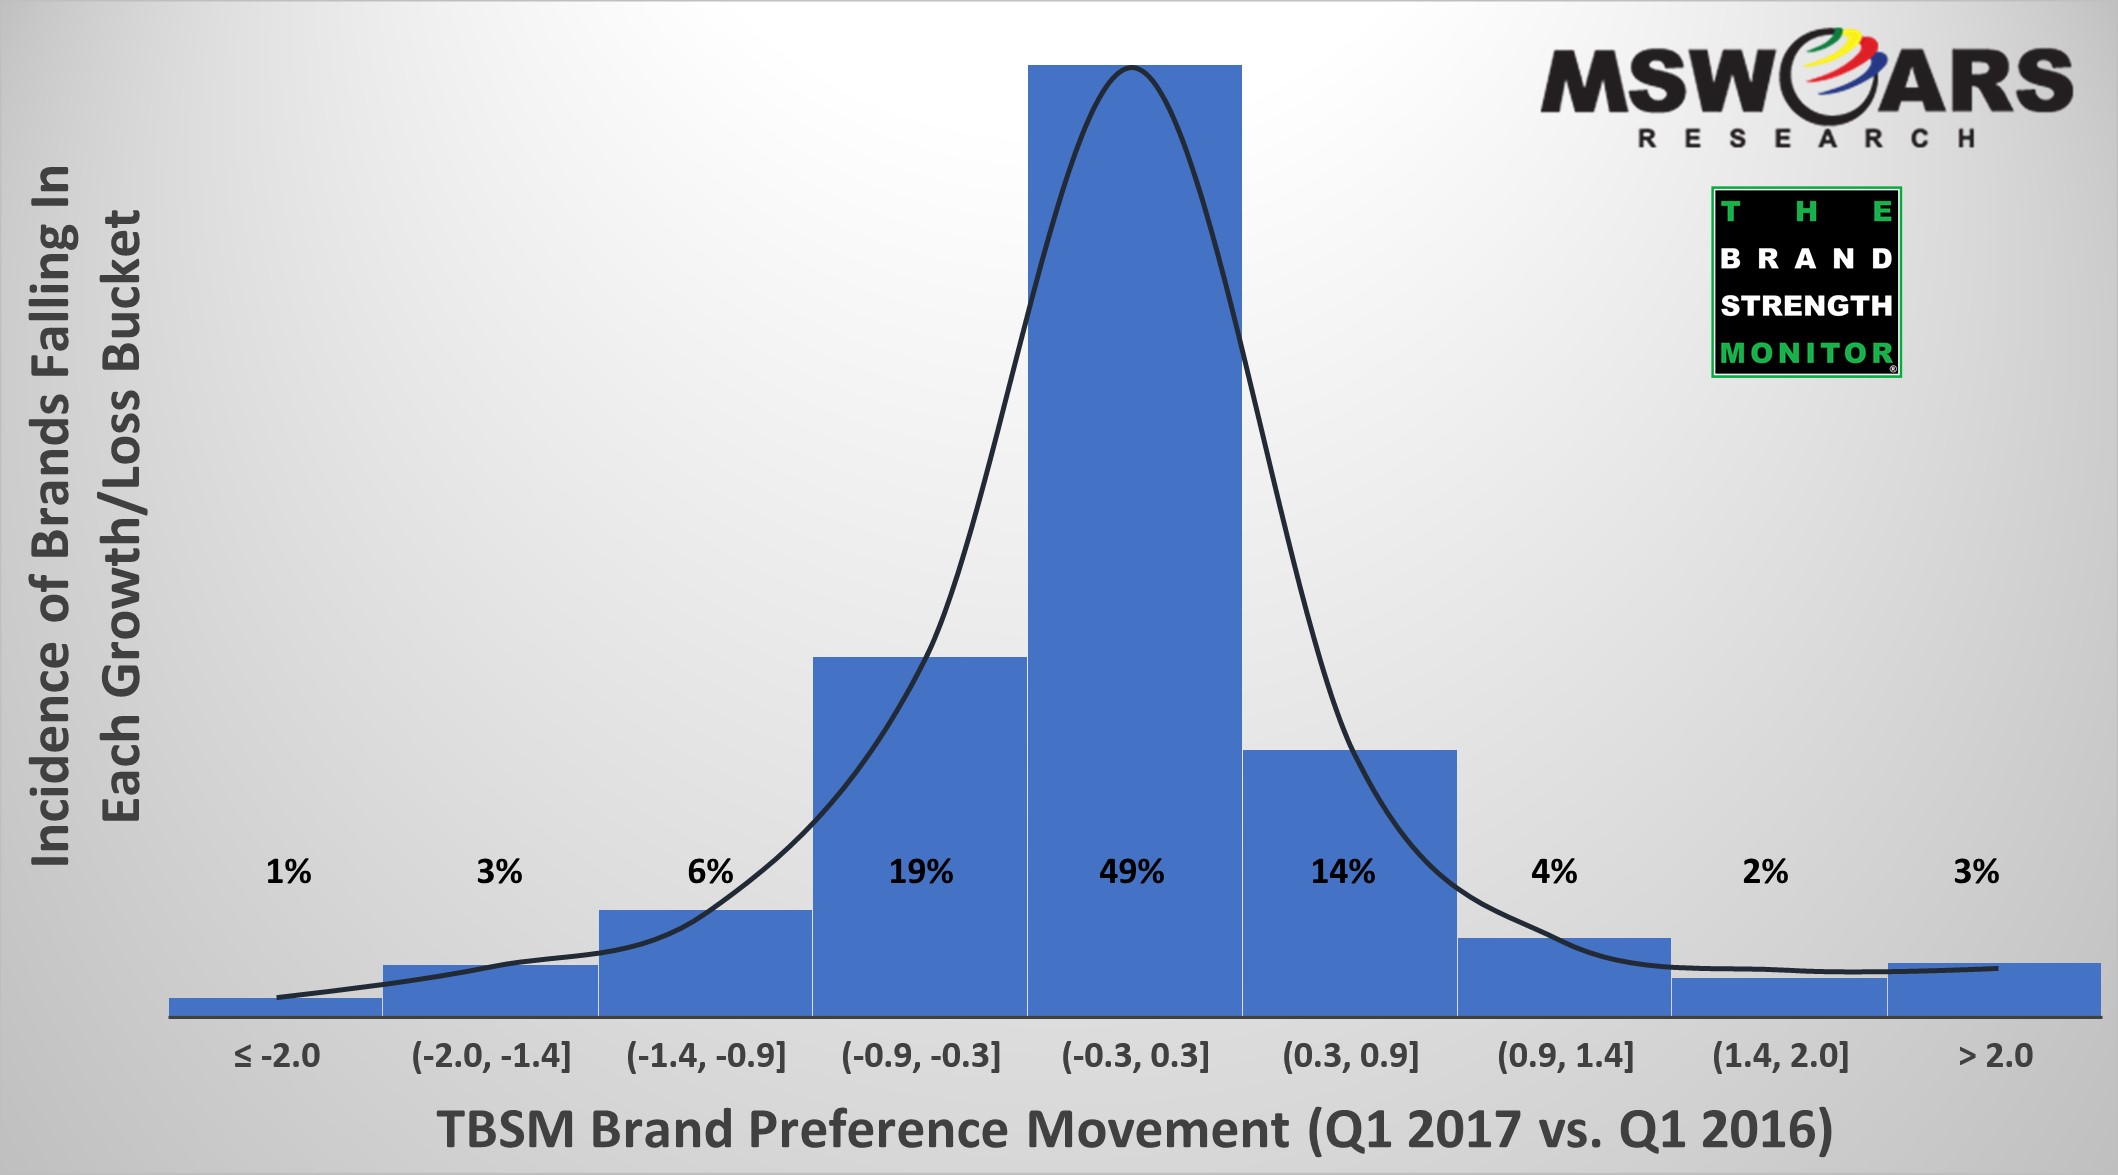
That’s why the +6.1 change achieved by Amazon Fire Digital Media Players, as well as the changes north of +3.0 for Adidas Women’s and Men’s Athletic Shoes discussed in previous blogs, was so impressive.
The brands this week are Pizza Hut and Papa John’s, which are tracked in the Quick Serve Restaurants (QSR) category. They have the unfortunate distinction of being part of the 4% of tracked brands that saw a loss of more than one and a half points in preference from Q1 2016 to Q1 2017.
If you have followed these brands recently, then you know that the news has been mixed with the good and the bad. Pizza Hut’s market share has reportedly been dropping while Papa John’s has had to answer for poor restaurant sales as well.
On the other hand, one of their main competitors, Domino’s, has been in the midst of somewhat of a Renaissance – so much so that their stock has been outpacing that of tech companies recently.
With our TBSM data, we are able to easily dissect which demographics are driving these decreases in brand preference in the table below.
First, here is the chart for Pizza Hut:
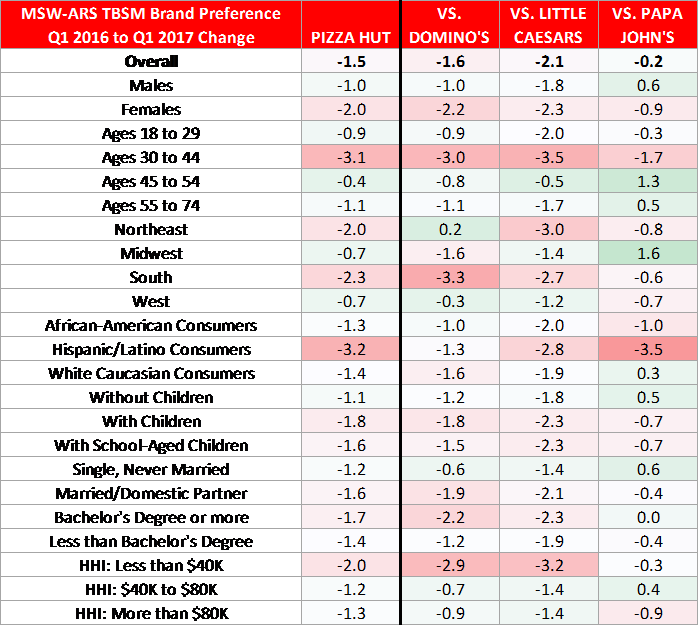
As you can see, Pizza Hut’s losses are driven by Hispanic consumers as well as those ages 30 through 44. They also have emerging opportunities with those in the eastern half of the US (Northeast, South), particularly Females.
While Domino’s and Little Caesars, the other primarily Pizza Takeout/Delivery companies tracked in this category, are going in a positive direction on many of these demographics. This includes lower income consumers and those living in the South.
Next, here is the chart for Papa John’s:
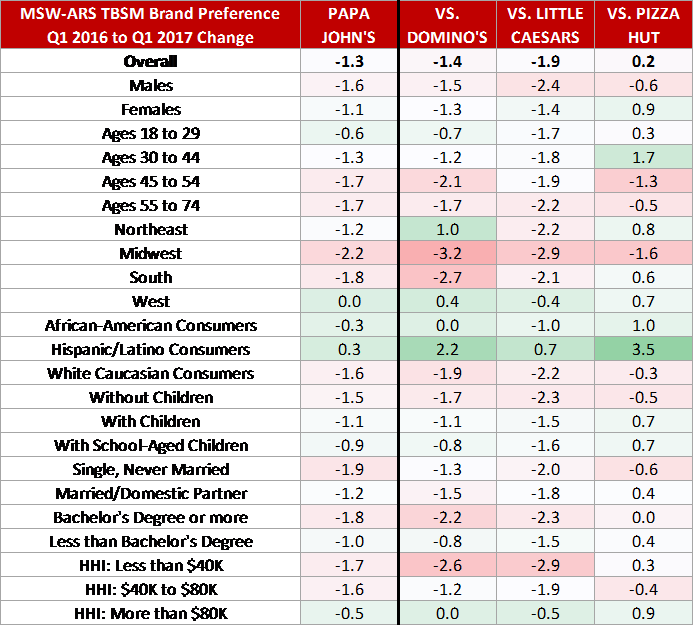
Unlike Pizza Hut, Papa John’s does not have an opportunity with losing Hispanic consumers as they gain versus each of the other three companies. However, like Pizza Hut, they also have a developing opportunity with lower income consumers, especially versus Domino’s and Little Caesars. Southern, Midwestern, Single, and College-educated consumers are also driving preference losses for Papa John’s.
If you would like more information regarding this or other data, then feel free to send us a line at sales@thebrandstrengthmonitor.com.
Thank you for reading and we look forward to sharing more learnings in the future.