
In January 2016, MSW●ARS Research launched The Brand Strength Monitor (TBSM), a syndicated service which tracks behavioral brand preference in a wide variety of categories among 1000 demographically balanced consumers each month. This has provided brands with an affordable, forward-looking read of their brand health using the MSW●ARS Brand Preference metric – the only independently validated measure of brand value. With this tool, brands in the over 60 categories currently being tracked are not only able to monitor changes in the health of their own and competing brands, but they have also been able to understand underlying category dynamics by cutting the data with the extensive demographic and purchase/usage data included with TBSM.
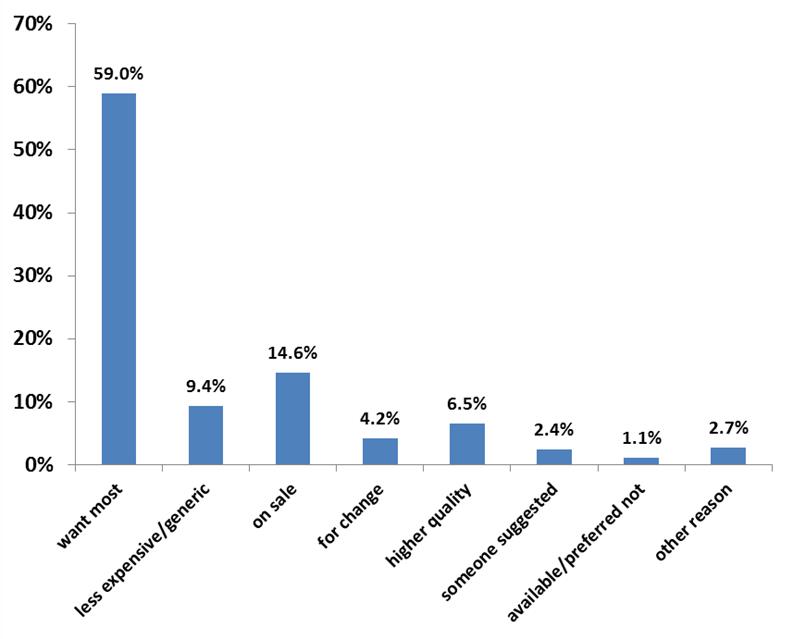
Starting in January 2017, TBSM was further enhanced by the collection of information on category purchasers’ motivation for their most recent purchase. Specifically, respondents who indicate they have personally purchased a product in the category in the past 6 months are asked to think back to their last purchase occasion and indicate why they chose the brand they did from among the following 8 options – it was:
- the brand I most wanted
- a less expensive/generic brand
- on sale
- for a change
- for higher quality/service
- what someone suggested to try
- available and the one I wanted wasn’t
- for some other reason
As we saw in the initial post on TBSM purchaser motivation data, across all categories on average 6.5% of respondents indicate that their choice of brand on their most recent purchase occasion was motivated primarily by a desire for higher quality or service:
Presumably many of these consumers have learned through recent experience the importance of quality in a particular product category and so sought out an option with a higher level of perceived quality rather than defaulting to their usual brand or seeking to save money. While this is possible in any product category, there are likely particular categories where quality is more often vital to the purchase decision. So we decided to ask, of the over sixty categories tracked by TBSM, which have the highest proportion of purchase occasions motivated by a desire for a higher level of quality or service?
The clear answer is services. In fact, services account for the top six categories and eight of the top twenty, with the top two being Homeowners/Rental Insurance and Auto Insurance (the others include banking related services, hotels, cable/satellite TV and cell phone service). Having recently filed a homeowner’s claim, I find this to be completely understandable. When you are in that situation, you don’t want any surprises – you want a quick response, a simple process and most importantly hassle-free payment for loss as stipulated in the policy. A little sympathy doesn’t hurt, either.
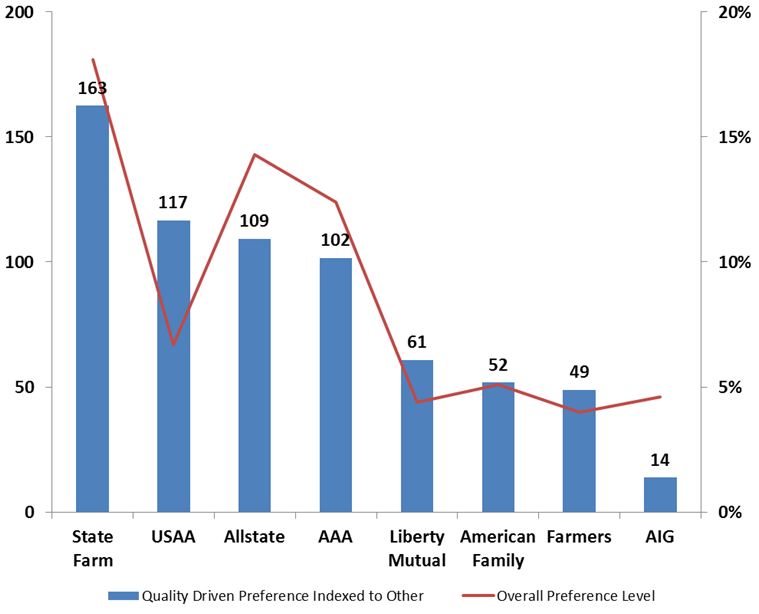
So in this category, what brands are most preferred by consumers who were driven by quality service considerations on their last purchase occasion? State Farm by a wide margin. Already the category leader, preference for State Farm jumps 63% among those concerned about quality service versus those who reported some other motivation. In fact, among the eight brands with an overall preference level of 4.0% or more, the four with the highest preference levels in general all over-index among those seeking quality service, while the four smaller brands all under-index. So clearly in this category the largest brands are more associated with quality service.
Interestingly, those respondents who bought based on quality considerations in this category do not differ markedly from those with other purchase motivations in terms of demographic profile, with the exception of being slightly more likely to be older and female.
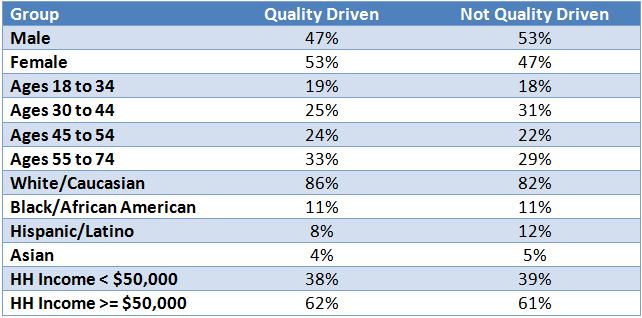
This suggests that decisions based on quality may be driven to a large extent by past experience, as supported by the prevalence of online reviews that indicate an intention to switch brands based on bad claim experience (e.g., “I experienced a similar difficulty with even getting an adjuster to come out. They denied my roof storm damage even without coming out to view the issue… Well I’m searching for a new insurer as well.”)
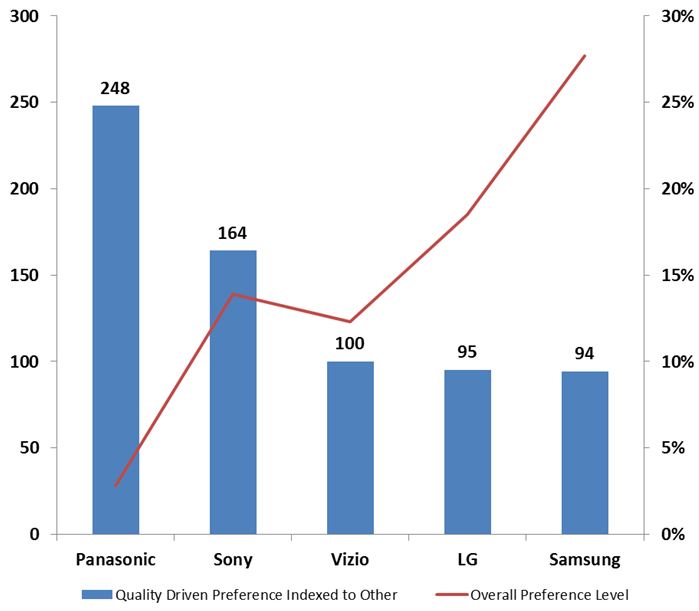
Beyond services, the remainder of the top twenty categories with the highest proportion of purchases motivated by the desire for higher quality/service is dominated by electronics and small appliances (e.g., smartphones, TVs, microwave ovens, streaming media players, etc.). We decided to take a closer look at the TVs category.
Unlike the homeowners’ insurance category, the largest brands do not over-index among quality seekers in the televisions category. Rather, it is the Japanese brands, Panasonic and Sony, which have the highest index of preference among those driven by quality to preference among those primarily driven by other factors. For the brand with the largest level of brand preference overall – Samsung – preference is actually slightly lower among quality seekers, perhaps reflecting some of the quality challenges the brand has faced in other categories over the past year.
Rounding out the top twenty are the two automotive categories tracked in TBSM (if you’ve ever had a lemon, you don’t want to repeat that sour experience) and men’s hair color (you don’t want to risk looking like, well, you know…).
Understanding the purchase motivations of your target consumers is an important piece in reaching them with a message that resonates. TBSM’s purchase motivation data in concert with extensive demographics can help enhance this understanding by category and among consumers who prefer particular brands. If you are interested in finding out how TBSM can help bring a better understanding of consumer dynamics in your category, please send us a note at sales@thebrandstrengthmonitor.com.