
In January 2016, MSW●ARS Research launched The Brand Strength Monitor (TBSM), a syndicated service which tracks behavioral brand preference in a wide variety of categories among 1000 demographically balanced consumers each month. This has provided brands with an affordable, forward-looking read of their brand health using the MSW●ARS Brand Preference metric – the only independently validated measure of brand value. With this tool, brands in the over 60 categories currently being tracked are not only able to monitor changes in the health of their own and competing brands, but they have also been able to understand underlying category dynamics by cutting the data with the extensive demographic and purchase/usage data included with TBSM.
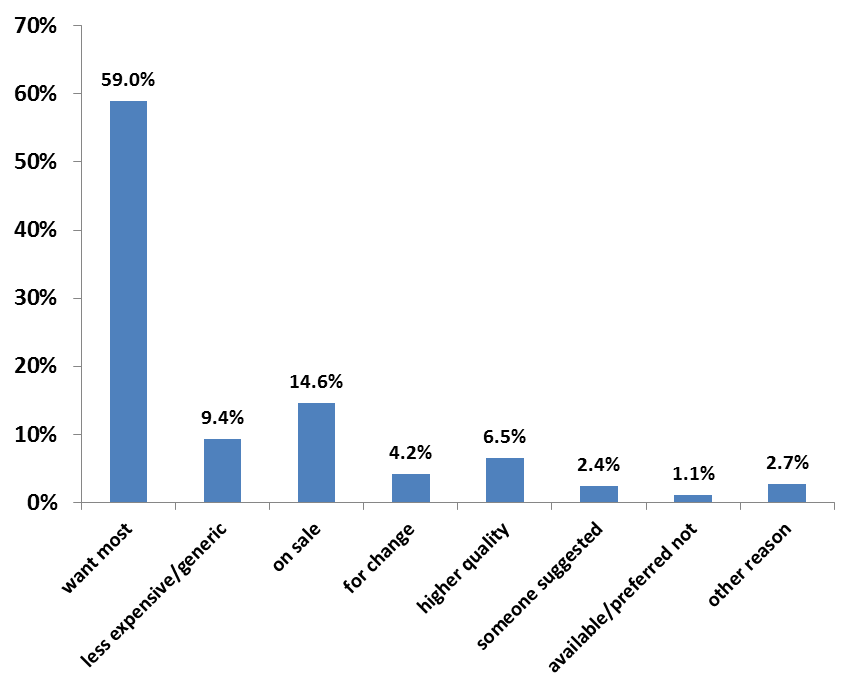
Starting in January 2017, TBSM was further enhanced by the collection of information on category purchasers’ motivation for their most recent purchase. Specifically, respondents who indicate they have personally purchased a product in the category in the past 6 months are asked to think back to their last purchase occasion and indicate why they chose the brand they did from among the following 8 options – it was:
- the brand I most wanted
- a less expensive/generic brand
- on sale
- for a change
- for higher quality/service
- what someone suggested to try
- available and the one I wanted wasn’t
- for some other reason
The results for the first quarter of 2017 averaged across all TBSM categories indicate that while consumers buy the brand they most want a little over half the time, there are also many purchase occasions motivated primarily by other considerations, especially by the desire to save money:
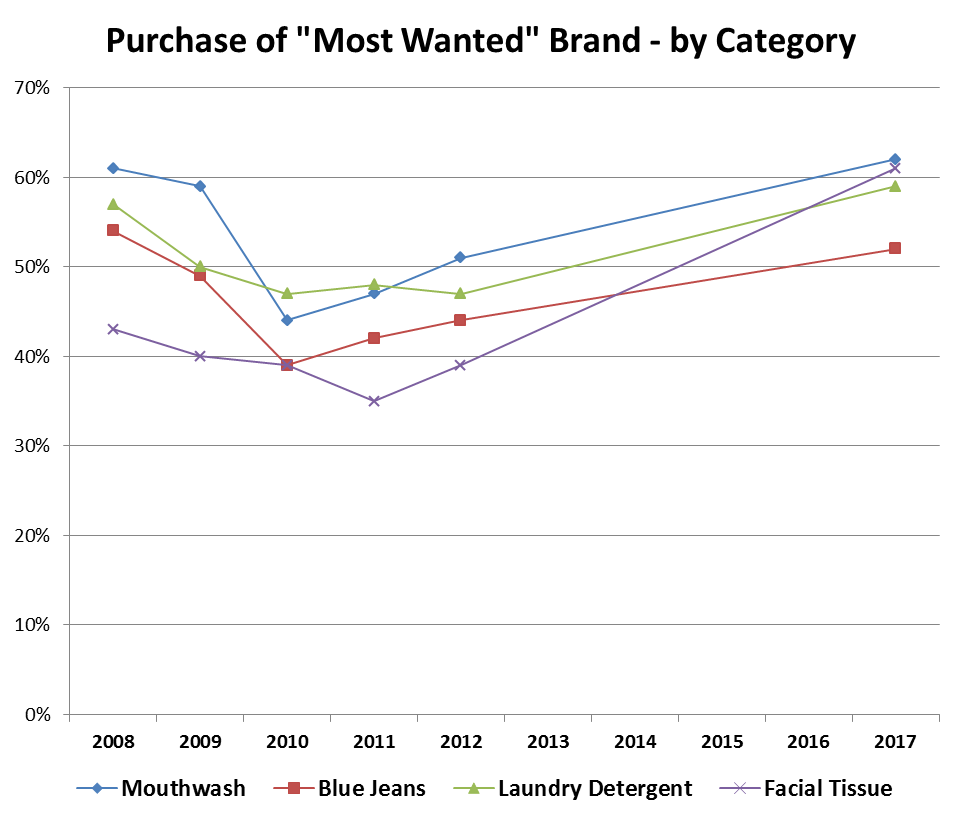
Past MSW●ARS research on “buy down” behavior (buying a lower priced product than the one you want most in order to save money) around the time of the Great Recession provides some context for these results. That research tracked the percent of consumers buying their “most wanted” brand in several product categories starting from just before the beginning of the recession in early 2008 through the next several years of recovery.
As the following graph of four categories tracked both in the earlier studies and in TBSM shows, consumers are now purchasing their most wanted brand at or above pre-recession levels with the exception of the highest ticket item among the four categories – blue jeans – which still slightly lags the level seen in early 2008. Moreover, in the facial tissue category, the percent of consumers purchasing their most wanted brand is now substantially higher than before the recession. As a category with a very high store brand presence, it is possible that consumers tried private label products during the recession in order to save money but found that they actually liked them to the extent that these became their “most wanted” in the category.
Of course, these purchase motivation results vary considerably by category, brand and demographic group.
As an illustration, the next chart shows a scatter plot of the percent of consumers purchasing their most wanted brand versus those who purchased based on price (a less expensive or on-sale brand) across all TBSM categories. The range of data on both axes illustrates how categories can differ in terms of consumers buying their most wanted brand (ranging from 40% to 70%) and buying based on price (ranging from 10% to 40%). In addition, the breadth of the scatter illustrates the variable importance between categories of the other reasons for purchase.
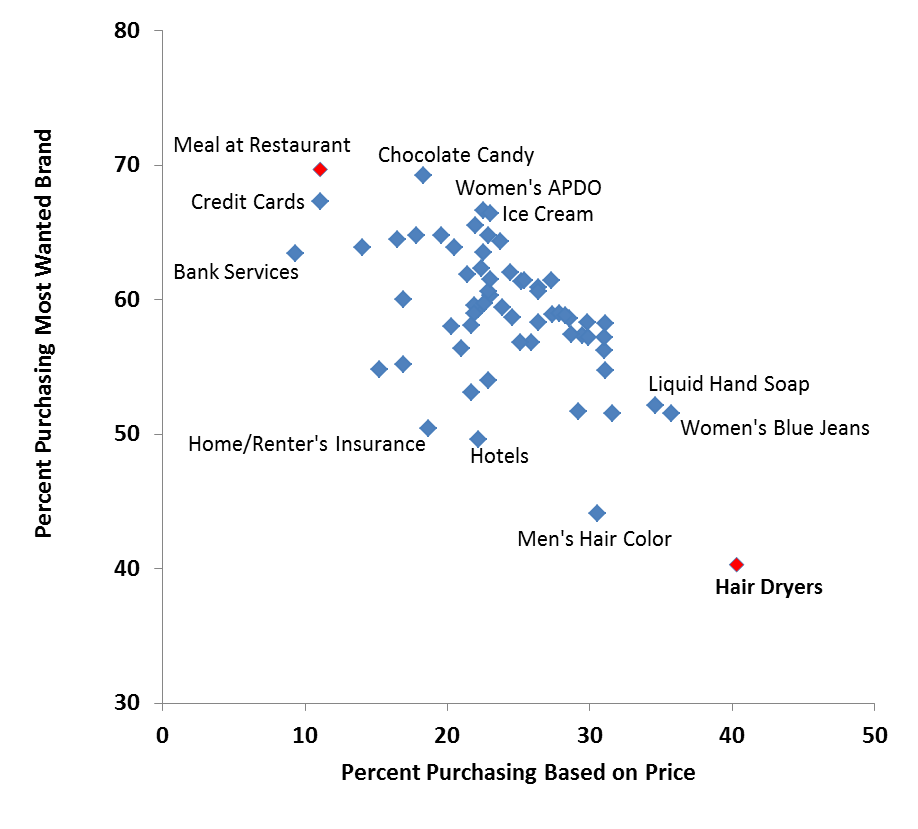
As indicated on the scatterplot, the most extreme categories in terms of percent of consumers purchasing their most wanted brand are restaurants on the high end and hair dryers on the low end.
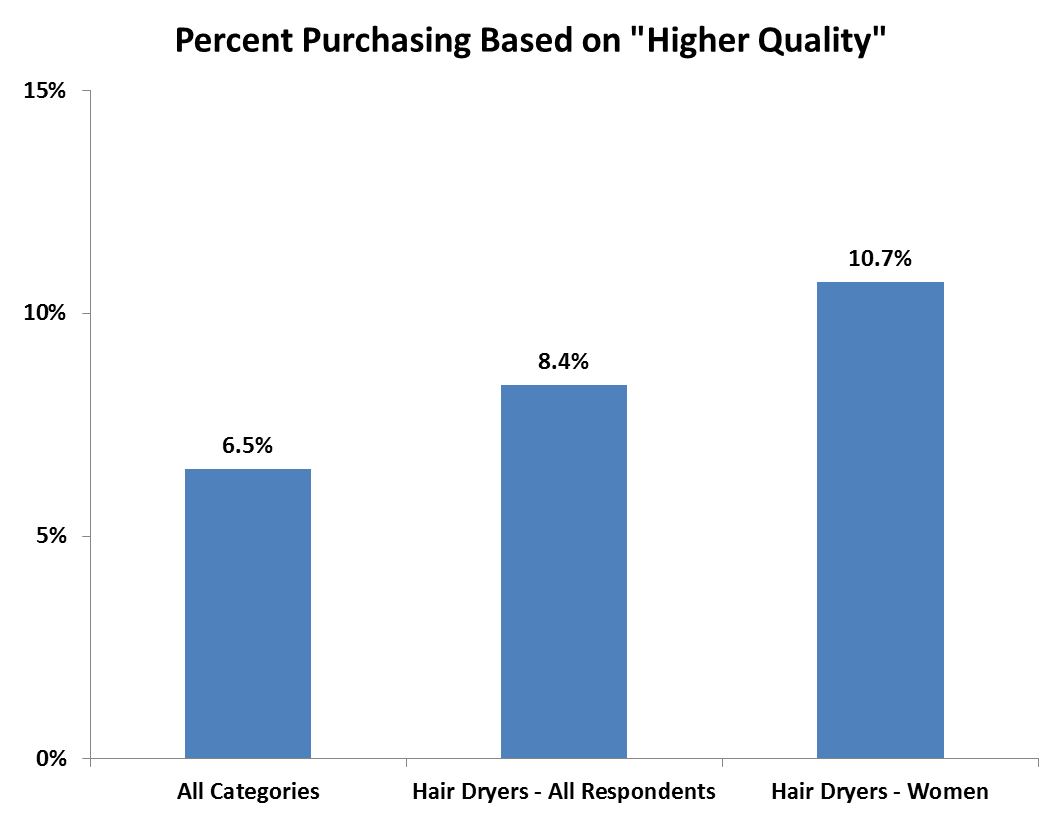
For hair dryers, which also exhibit the highest proportion of purchase decisions being motivated by price considerations, this probably shouldn’t be surprising. The purchase cycle is long, the amount of advertising in the category is very low and the price range is large. Consumers may well wonder if the extra outlay is really worth it. However, one interesting aspect of the category is that despite the large emphasis on price, there are also more purchasers who were motivated by a desire for higher quality than is typical in other categories. This is especially true for women, who are more likely to purchase in the category anyway, suggesting an exploitable opportunity for marketers in this category.
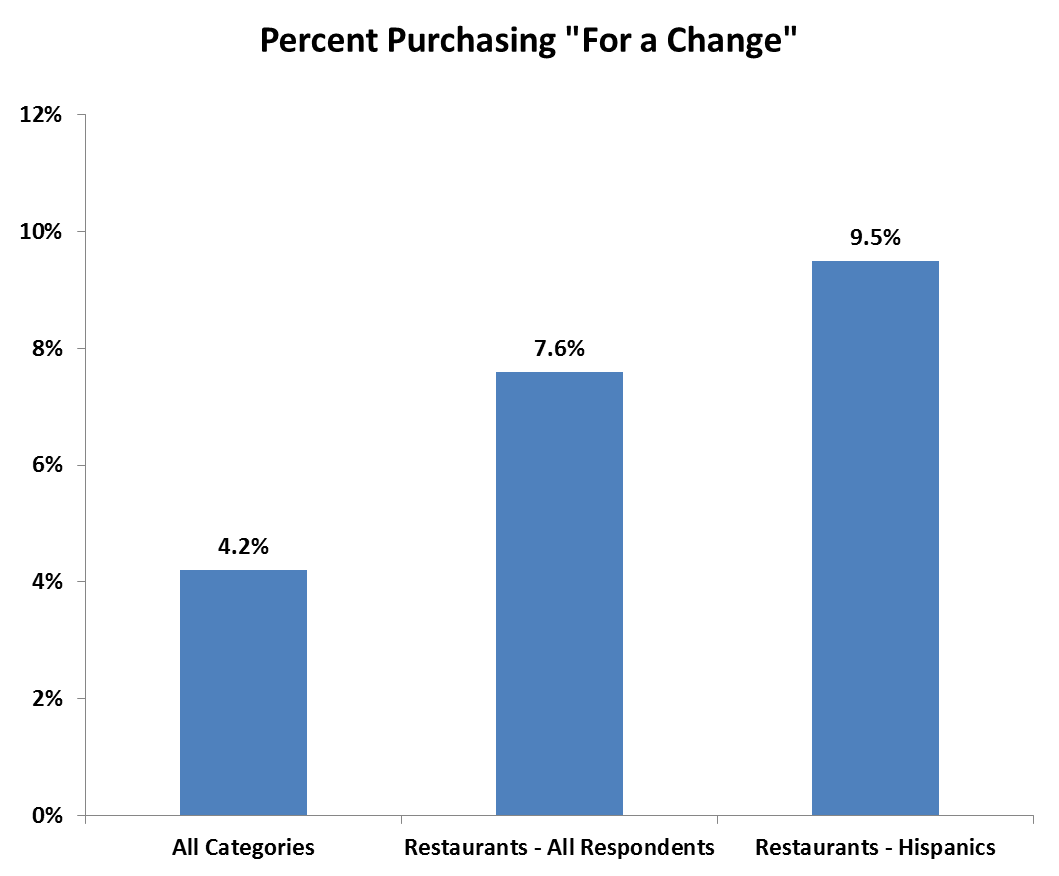
On the other hand, restaurants would seem to be the ultimate variety seeking category. Plus, there is never a shortage of coupons or special offers, particularly among the quick serve segment. Despite these factors, the data suggest that on a particular dining occasion, the stomach rules and diners usually head for what they want most at that point in time. At the same time, there is still evidence of variety seeking in the category. While the percentage of consumers who made their most recent restaurant purchase based on price considerations is very low, the percent who claimed they purchased their last meal at a restaurant “for a change” is the second highest among all TBSM categories. Hispanic respondents in particular indicate a high level of variety seeking in this category.
In the coming weeks we will be sharing some additional insights into how this new addition to The Brand Strength Monitor can be leveraged to bring an enhanced understanding of consumer purchase behavior. In the meantime, if you have any questions or are interested in finding out how TBSM can help bring a better understanding of consumer dynamics in your category, please send us a note at sales@thebrandstrengthmonitor.com.