
Brand managers can change pricing and distribution, but that doesn’t always translate into a change in market share. That is because there is a variable in the equation that can make or break forecasts put in place using pricing and distribution figures alone. That variable is brand preference.
We here at MSW-ARS have a brand preference measure that is unlike any other because it is the ONLY independently validated measure of brand preference available.
Though we’ve been collecting our brand preference measure for decades, a recent breakthrough occurred in January 2016 when we launched The Brand Strength Monitor (TBSM), which made the measure widely available in a syndicated system. It allows brands to receive a monthly update on their brand health that can easily be split by key demographics for a very reasonable price due to the syndication.
In this blog series we’ll be sharing insights from this data, and focusing on the biggest winners and losers from Q1 2016 to Q1 2017, including causes as well as implications for their respective categories.
Last time, we kicked off this series by introducing the #1 gainer – Amazon Fire Stick (Streaming Media Player). This week, we are going to share another brand gaining serious traction over the past year.
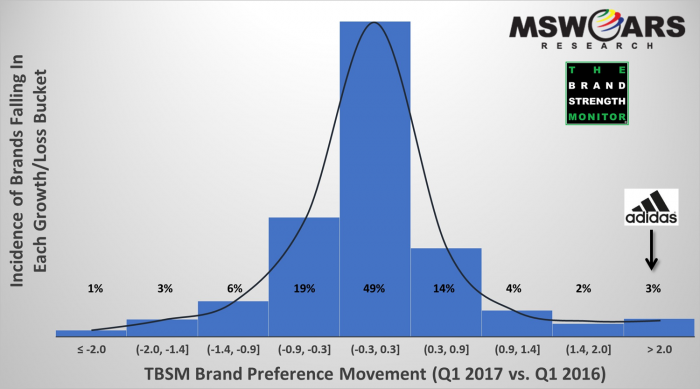
First, we would like to remind you just how difficult it is for a brand to move our brand preference needle (like actual market share itself). It does not overreact by showing changes that are not happening in market. In fact, as the following bell curve shows, about half of the 750+ brands tracked during Q1 2016 and Q1 2017 see essentially no change (±0.3). Over 80% of the brands we track see a change of a point or less. That is why the +6.1 change achieved by Amazon Fire Digital Media Players (shared last time) was so impressive, and why the brand for this week is also very noteworthy.

That brand is Adidas, which we track in the athletic footwear category. In the above bell curve, Adidas is in the column on the far right with brand preference growth north of two points. That alone is remarkable, but we should mention that is actually happening in two different categories we are tracking: both Women’s and Men’s athletic shoes. Their growth knows no gender barriers. Overall, out of 750+ brands, Adidas Men is #2 in terms of growth (trailing only the aforementioned Amazon Streaming Media Players) and Adidas Women is #6 – pretty amazing.
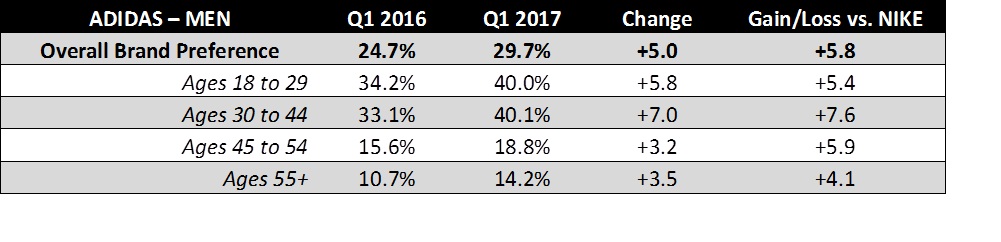
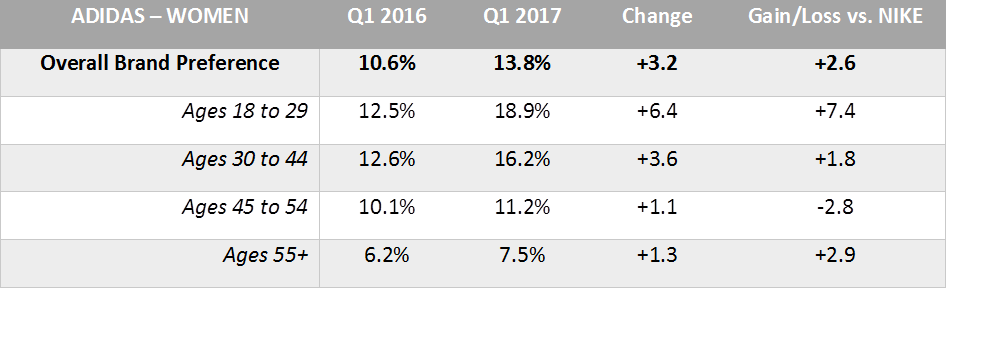
As the tables below show, this is thanks in part to particularly strong gains in some key age demographics, which are easily pulled from the TBSM platform along with other census-balanced demos. Growth among younger consumers is definitely an important driving force among both Men and Women.
Why is Adidas doing better with younger consumers? There are theories out there, such as what Fortune.com shared midway through 2016 in their informative article: Why Adidas Is Outperforming Nike, Under Armour. We certainly have our thoughts as well through the other demographics and data splits available via the TBSM platform.
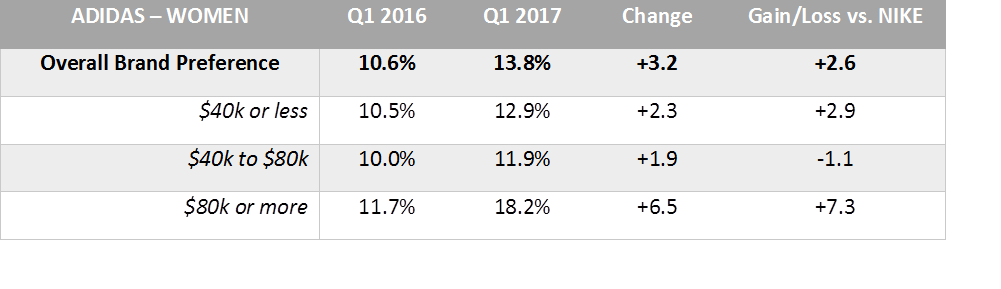
For Women, the story can be further told by the income data in the table below. Adidas growth has been mostly driven by those with higher income, as the chart below shows. Nike has not grown with these higher income consumers, which has led to Adidas making up even more ground on them.
For Men, unlike Women, income segments have yielded similar growth patterns. The most eye-opening growth differences among Men are with race and ethnicity. Overall, Adidas growth has been strong among Men despite their standing with African American (AA) consumers, who actually are slightly less likely to prefer Adidas in Q1 2017 than Q1 2016. On the flip side, there have been large positive changes among Hispanic and White consumers, including a near double-digit gain among Hispanics.
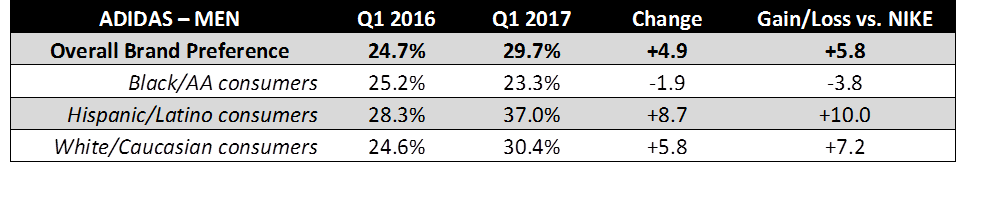
Net: Adidas growth is strong among Men and Women due especially to growth among younger consumers. Women with higher incomes are also boosting Adidas preference, and likewise among Hispanic/White Men.
If you would like more information regarding this or other data, then feel free to send us a line at sales@thebrandstrengthmonitor.com.
Thank you for reading and we look forward to sharing more learnings in the future.