
In January 2016, MSW●ARS Research launched The Brand Strength Monitor (TBSM), a syndicated service which tracks behavioral brand preference in a wide variety of categories among 1000 demographically balanced consumers each month. This has provided brands with an affordable, forward-looking read of their brand health using the MSW●ARS Brand Preference metric – the only independently validated measure of brand value. With this tool, brands in the over 60 categories currently being tracked are not only able to monitor changes in the health of their own and competing brands, but they have also been able to understand underlying category dynamics by cutting the data with the extensive demographic and purchase/usage data included with TBSM.
Starting in January 2017, TBSM was further enhanced by the collection of information on category purchasers’ motivation for their most recent purchase. Specifically, respondents who indicate they have personally purchased a product in the category in the past 6 months are asked to think back to their last purchase occasion and indicate why they chose the brand they did from among the following 8 options – it was:
- the brand I most wanted
- a less expensive/generic brand
- on sale
- for a change
- for higher quality/service
- what someone suggested to try
- available and the one I wanted wasn’t
- for some other reason
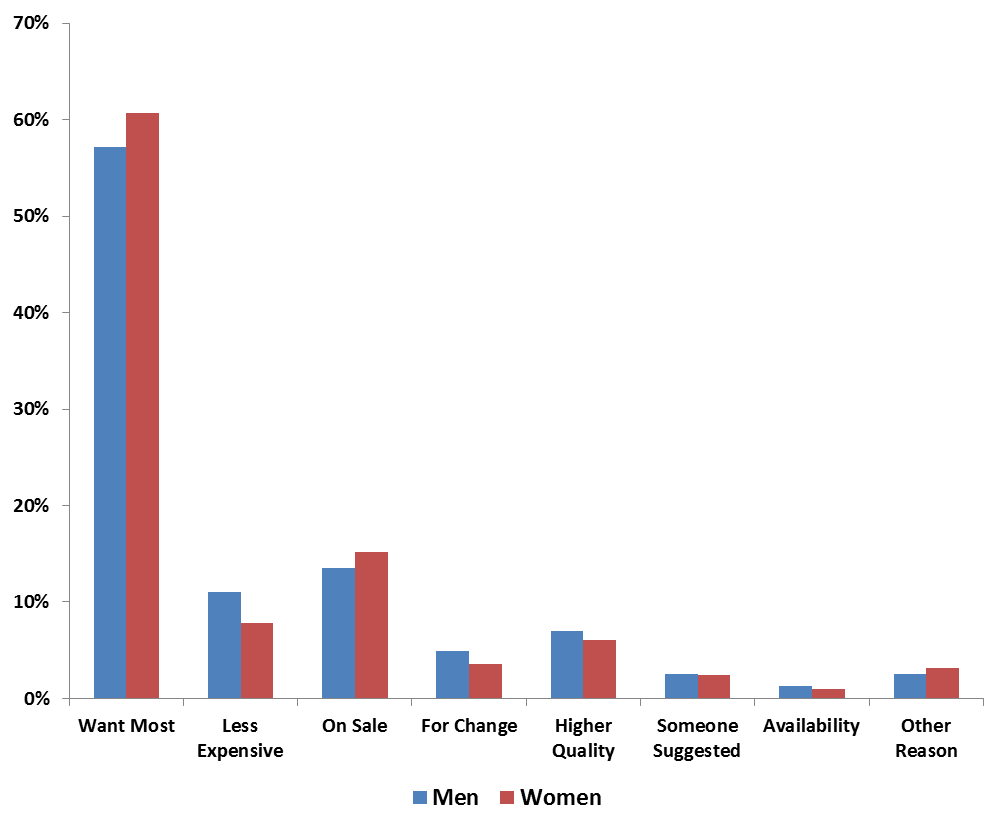
We thought it would be interesting to examine these different brand purchase motivations by gender. Are men or women more likely to purchase the brand that they want most and is this consistent or category dependent?
Well, it turns out that on average women are more likely than men to purchase the product that they want the most. And when it comes to finding value, women are more likely to go to the work of finding a good sale while men are more likely to just go with a less expensive brand than the one they want most.
As the following scatterplot of all categories illustrates, women are more likely to buy the brand they want most in the majority of categories. However, there are a number of categories where men are clearly higher and there are some interesting trends in the types of categories where women versus men tend to be more likely to purchase what they want most.
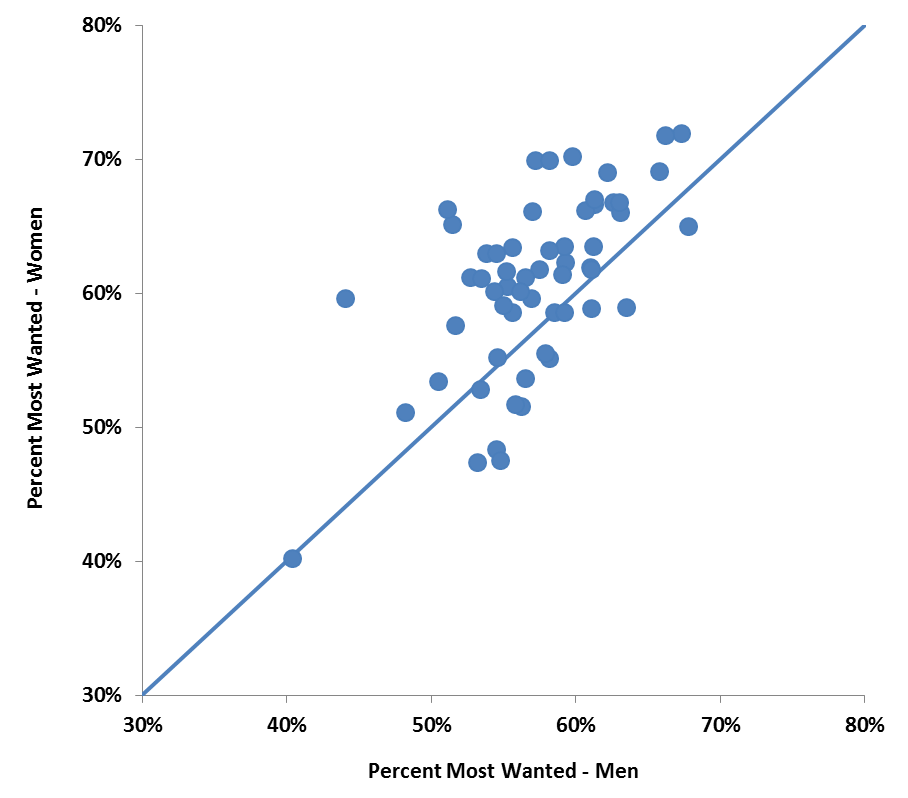
The product category in which women are more likely – by the largest margin – than men to buy what they most want is personal care, with an average difference of 7.7%. The personal care categories with the largest differences are hair color and facial moisturizers, but women are more likely to buy what they want in every personal care category we track, including deodorant, bar soap and mouthwash. So the next time you’re thinking about squeezing onto a crowded elevator, if it’s full of a bunch of guys… you might want to wait.
Women are also much more likely to buy what they want most when it comes household cleaning and laundry products as well as packaged food items, with women particularly intent on getting what they most want in the chocolate, chewing gum and tea categories.
When it comes to electronics, results are split. Women are more likely to buy what they most want for portable items such as smart watches, fitness trackers, smart phones and tablets. Men are more likely than women to follow their hearts when shopping for televisions, computers and streaming media players.
In both apparel categories that we track (athletic shoes and blue jeans) men are substantially more likely than women to buy what they prefer most – despite our proclivity to cut corners when it comes to personal hygiene, we apparently still want to look good. Home entertainment products are also more likely to entice men to splurge on what they want most, as among the products men are more likely to buy what they want most, televisions are number one with streaming media players and cable/satellite TV subscriptions both in the top eight. And while we are enjoying our favorite programs… Pop something in the microwave (number two after TVs) and finish off that tub of ice cream (the only packaged food product men are more likely than women to buy what they most want).
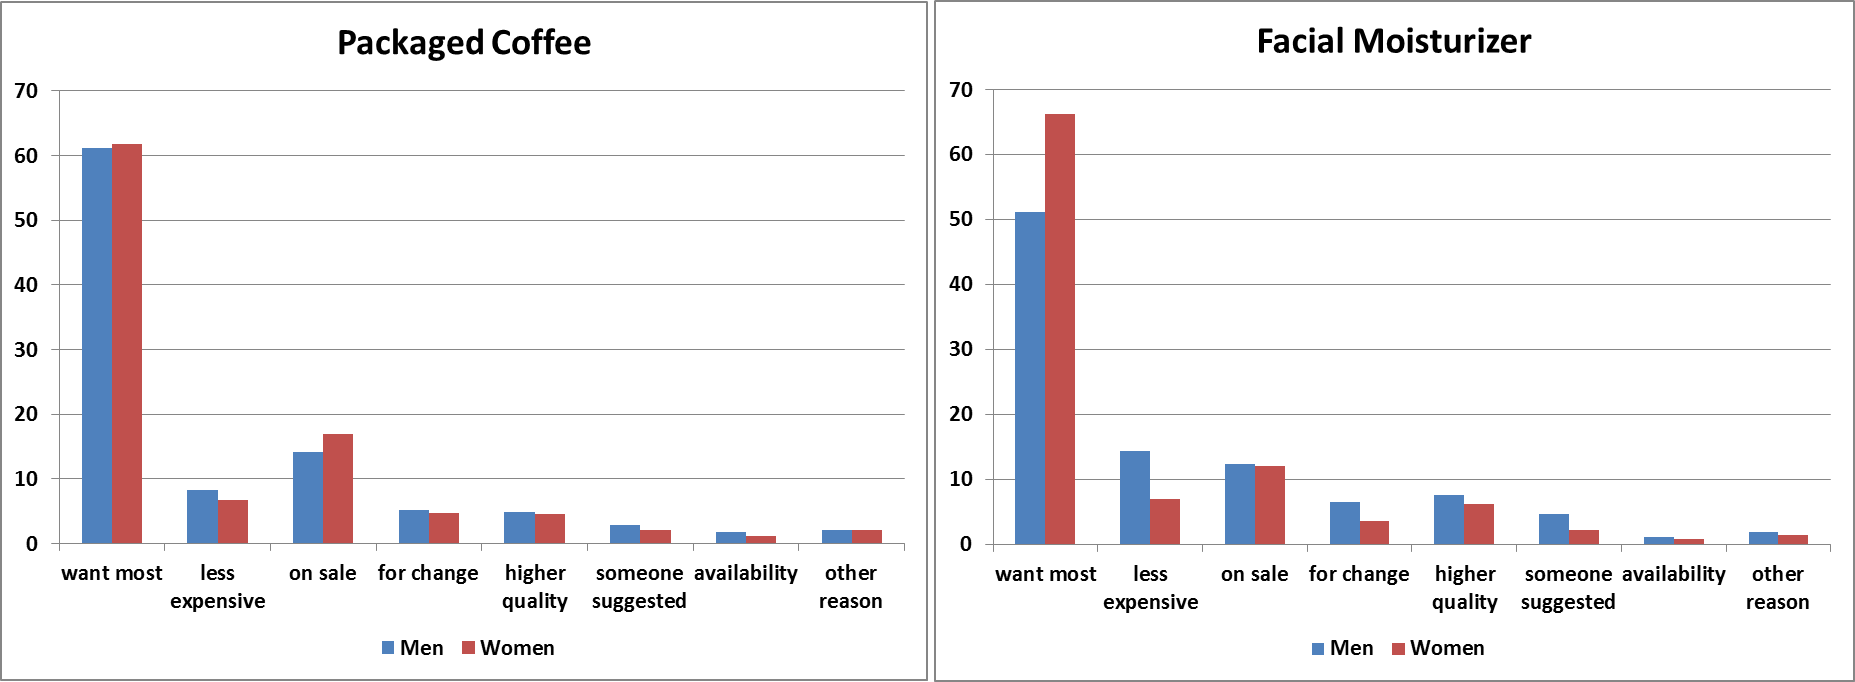
Can men and women agree on anything? Well, coffee it seems comes the closest. The distributions for men and women among the different purchase motivations are nearly identical.
One category with large differences in purchase motivation by gender is facial moisturizers. Only about half of men purchase what they most want compared to about two-thirds of women, while the proportion of men going for a “cheap one” is more than double that for women.
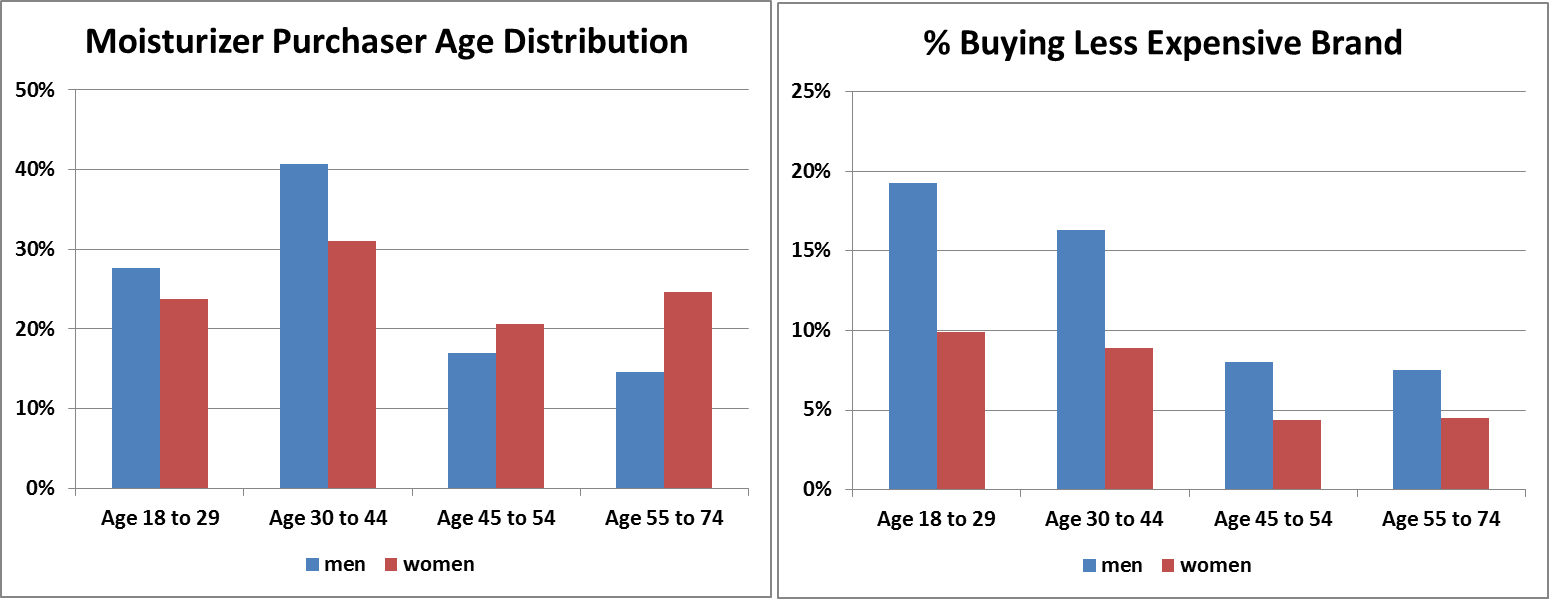
However, demographics shed some additional light on these findings. While far fewer men than women purchase in this category, those that do skew much younger than do female purchasers. Younger purchasers, especially younger men, are much more likely to have purchased a less expensive brand than the one they most wanted, contributing to the large gap in percent buying a less expensive brand between men and women.
Beyond age, male purchasers in this category are more likely to have children at home than female purchasers. As any parent knows, children both strain the budget and accelerate the aging process. So it should be no surprise that male purchasers with children are much more likely to buy a less expensive brand than their most favored compared to those without children. In fact, men 18 to 29 with children are over 5 times more likely to buy a less expensive brand than are men 55 to 74 with no children.
Another observation in the category that perhaps seems at odds with men buying a less expensive brand much more frequently than women is that men are also more likely to say they buy a different brand for “higher quality”. However, two-thirds of male moisturizer purchasers are in the higher income range compared to only half of female purchasers. These higher income males are more likely to purchase a brand for its higher quality. This presents a potential target for which brands in the category could use TBSM to investigate current preferences and additional demographic characteristics.
Understanding the purchase motivations of your target consumers is an important piece in reaching them with a message that resonates. TBSM’s purchase motivation data in concert with extensive demographics can help enhance this understanding by category and among consumers who prefer particular brands. If you are interested in finding out how TBSM can help bring a better understanding of consumer dynamics in your category, please send us a note at sales@thebrandstrengthmonitor.com.