If you are a sports fan, then chances are you are aware that this is quite an exciting time of the year for College Football. With all the talk of rivalries, advantages, disadvantages, and strategies, it made us here at MSW-ARS think: What if top brands played in bowl games? How would those matchups look?
Using our 2016 Brand Strength Monitor data (TBSM), we did just that, and we will be sharing these throughout the month.
To date, we have taken a look at the following “matchups”:
This week, we are going to continue picking out some of the biggest “rivalries” based on our TBSM data.
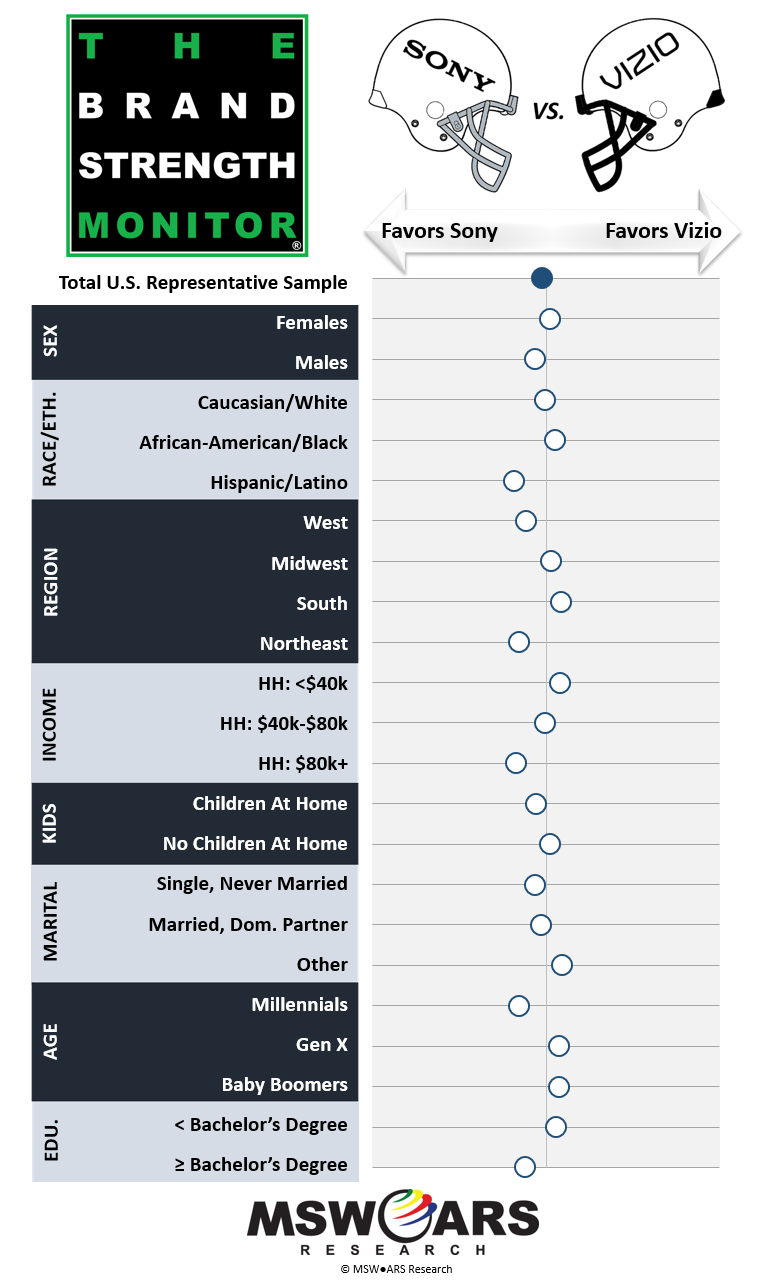
A lot of eyes are going to be glued to televisions next week when the College Football championship between the University of Alabama and Clemson University kicks off (it’s also a rematch from last year’s title game, by the way). So, what better category to kick off this week than televisions? This category includes a lot of heavyweights, but we will focus on two in particular this week that are undoubtedly considered with one another when consumers are making purchase decisions: Sony vs. Vizio.
|
|
A quick glance at this matchup shows some decent spreads across certain demographics. In what is overall a very tight matchup, it is worth noting that Sony tends to do better with younger, higher income/educated consumers in the West and Northeast, with their largest advantage being with Hispanic consumers. Vizio does better with older consumers in the South with lower incomes. This makes sense as Vizio has long been known as a producer of affordable, flat-screen TVs. |
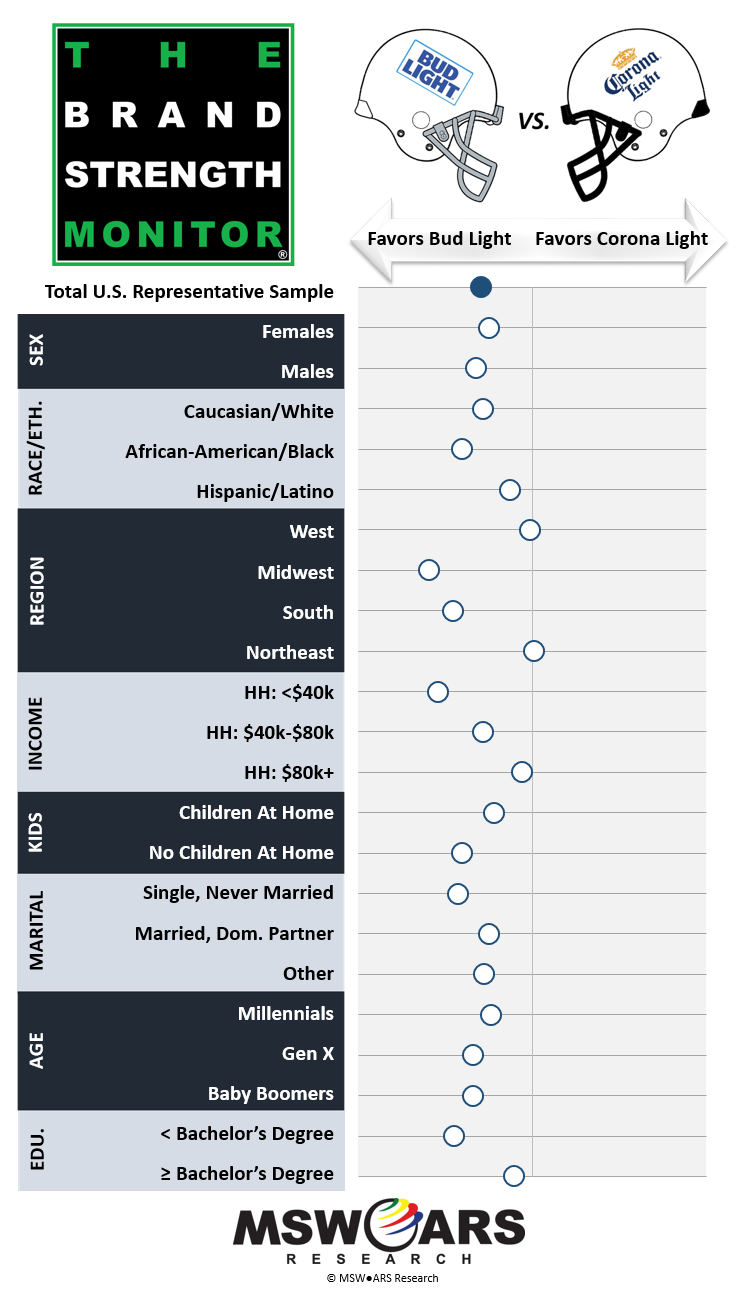
Next up, we are going to look at a category that is certain to be consumed as a complement to televisions come title game time: Light Beer. Over the better part of the past decade, one of this year’s title game participants, Alabama, has had quite a dynasty with multiple championships and always with one of the nation’s best squads. A lot of times preseason prognosticators have an “Alabama or the field”-type analysis. The same can be said with the Light Beer category. There is little dispute that Bud Light is the leader.
|
|
However, as strong as Bud Light is with just about every demo split, Corona Light has their own strengths that threaten to dethrone Bud Light among certain demographics. The most notable relative strengths for Corona exist within two regions: The Northeast (where they actually lead narrowly) and the West. This is undoubtedly due to their strengths on the coasts. Not far behind are the splits for income and education, which show those consumers with higher levels of these moving more towards being a “toss up” between the two brands. Also, it is important not to forget to mention Corona’s decent standing with Hispanic/Latino consumers, though to be fair, Bud Light does still lead with them. |
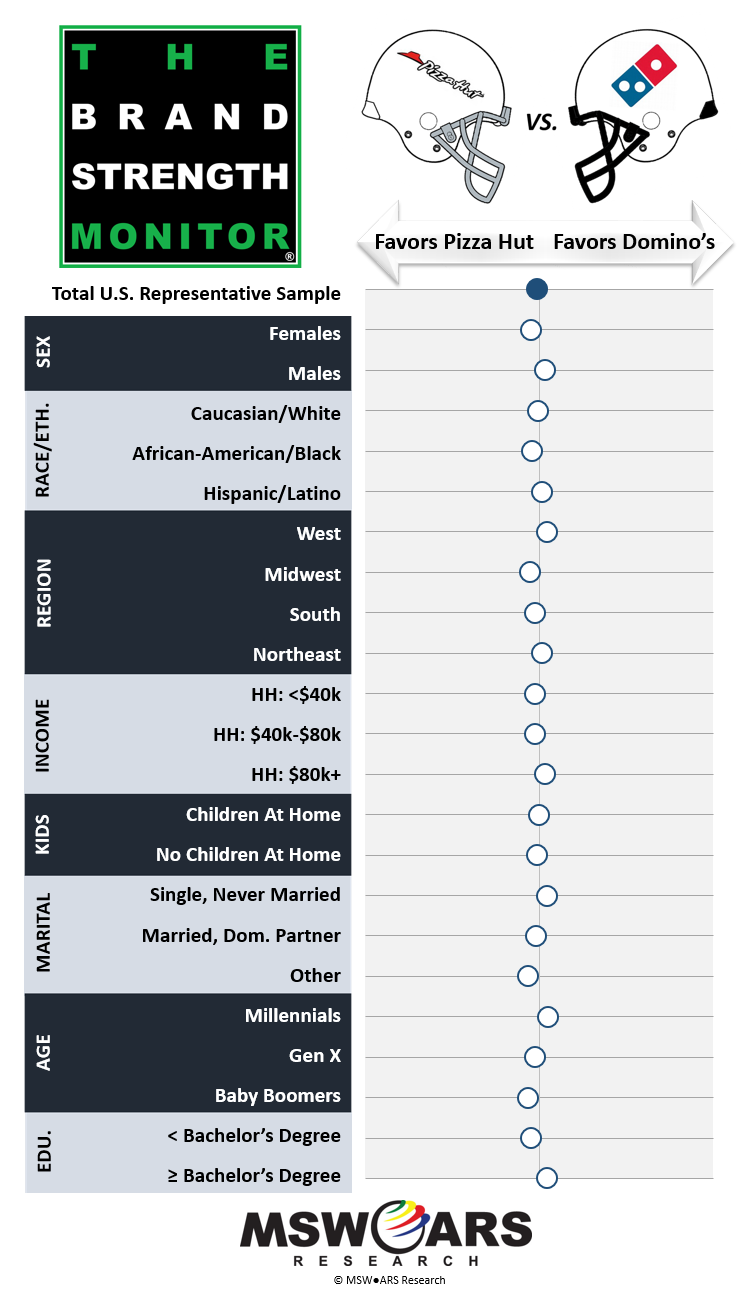
Chances are if you are going to be sitting in front of a TV watching football with some Light Beer, then you are probably also considering ordering a pizza (or, at least, that would sound pretty good to us). So, let’s take a look at two leading quick-serve pizza companies: Pizza Hut vs. Domino’s.
| At a glance, using the same scale as the other rivalries, it is very difficult to see a lot of differences among demographics given the similar preference levels for both. This is a rivalry in the truest sense as both brands’ profiles suggest a lot of overlaps in consideration and constant competition with one another. Though none of these advantages are truly sizable, Pizza Hut tends to do better with Baby Boomers as well as Midwesterners, while Domino’s appears to do better with higher-educated Millennials.
|
|
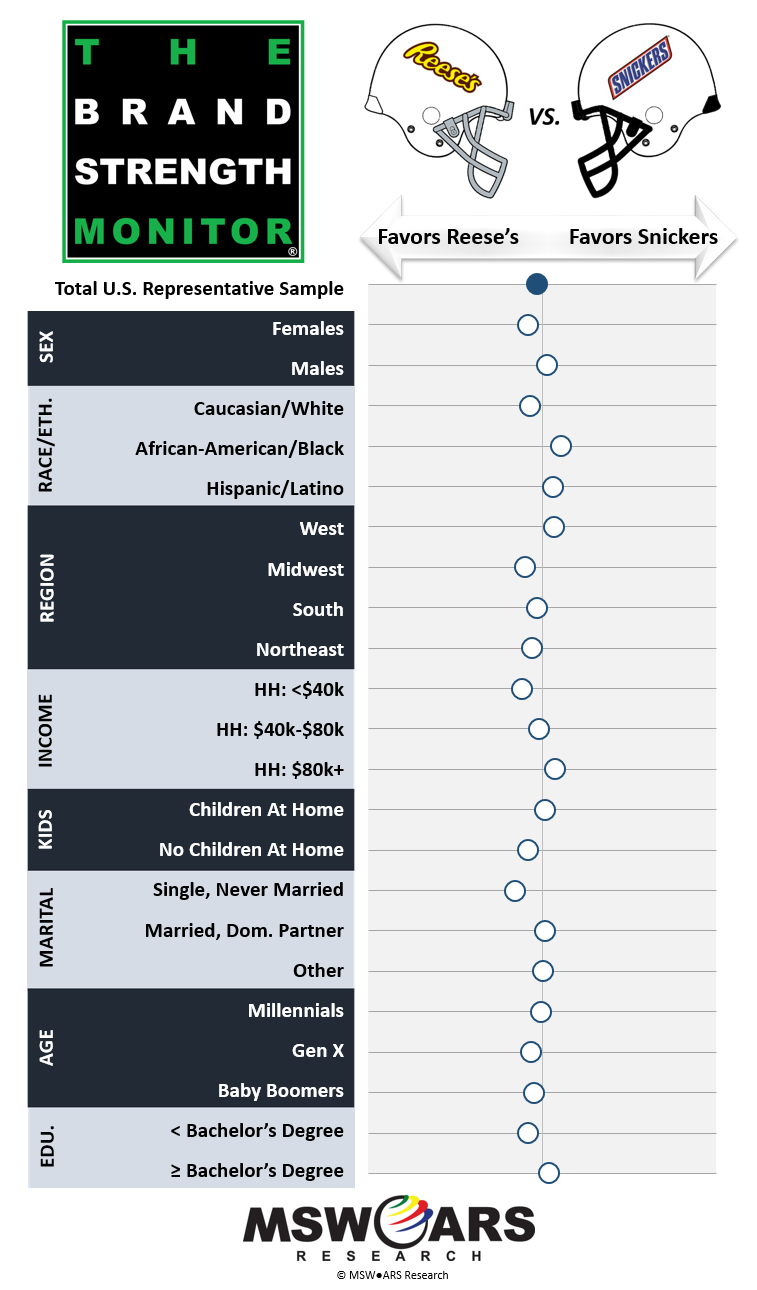
And, if you’re going to have Pizza and Light Beer while watching the game, then why not have something for dessert in order to finish strong such as our final category: Chocolate Candy? In this case, we will look at Reese’s vs. Snickers.
| Though many love both of these brands and likely eat them together without much hesitation, we actually see “first choice” brand preference gaps that are noteworthy. For example, Reese’s does better among single, lower-income consumers in the Midwest. Snickers trends better with higher-income consumers in the West – as well as with African-Americans and Hispanics/Latinos.
|
|
That is it for this week, but we will be back with more matchups before the end of the bowl season.
If you would like to know more regarding the data and platform used here, then please contact us at sales@thebrandstrengthmonitor.com
Our TBSM metric is the ONLY Independently Validated Measure of Brand Value.
Thank you very much for reading and we hope you enjoy future weeks’ blogs as well as the actual bowl games!


