
It is difficult to watch or read the news without hearing about political divisions in the US. Whether
they’re talking Democrats, Republicans, Libertarians, or the Green Party, there seems to be a lot
of disagreement out there. However, we here at MSW●ARS Research have discovered factions you may
not have even known existed until now – with consumer categories. As a fun repurposing of the data
we collect using our Brand Strength Monitor platform, we are getting to the bottom of this – one
category at a time.
Throughout the 2016 US Presidential Election season we’re sharing some “voting” results. Instead of the
traditional red state/blue state/swing state format, we’re looking at “voting” results for some of
the more than 60 categories on The Brand Strength Monitor Dashboard to determine which brand would
win an election versus its category competitors.
Instead of simply looking at the “popular vote” across thousands of respondents, we decided it would
be a lot of fun to look at results by state Electoral College votes – similar to how the US actually
elects its president every four years.
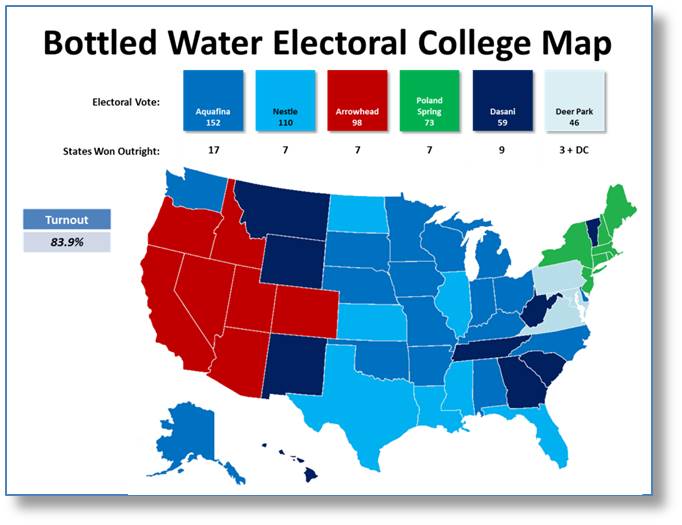
Last week, we discussed the state of the Light Beer category, but at least that one had a brand achieve 270+ electoral votes. With this week’s category,
Bottled Water, this election is not being decided any time soon as each brand is at least
100+ electoral votes away from the 270 threshold.
- Aquafina, the PepsiCo brand with the current lead in this category, benefits from a very wide
appeal as they win in various regions of the country. They win in the South with states like
Alabama and North Carolina. They win in the West with states like Washington and Alaska. However,
their biggest strengths come from the Midwest, where they win the majority of the states – including
Ohio, Michigan, and Missouri.
- Nestle branded water competes in a lot of the same areas as Aquafina and is able to win big
states in the South and Midwest, including Texas, Florida, and Illinois.
- The Coca-Cola Company’s Dasani brand also competes with Aquafina and Nestle throughout the South, Midwest, and other parts of the country. Though Dasani is often able to come away with a sizable amount of votes in each state, they only have sizable wins in and around Coca-Cola’s home turf in Georgia, as well as the bordering states of Tennessee and South Carolina. Its other wins are all in states with a handful of electoral votes or less.
- Next, here is where things get really interesting. The next three brands dominate preference among three certain regions of the country:
- Arrowhead, named after a rock formation in the San Bernardino Mountains in California,
essentially owns the western continental US with wins in California, Arizona, Nevada, and Colorado.
- Deer Park, named after the town in western Maryland, is the Mid-Atlantic brand of choice with
wins in Pennsylvania, Maryland, Virginia, and DC.
- Poland Spring, manufactured in southern Maine, is the brand of choice in New England,
(aside from Vermont, which may be a base size issue there), as well as New York and New Jersey.
- Yes, these regional brands either are or have been subsidiaries of Nestle, but their dominance
in their respective regions is still pretty remarkable.
In case you’re wondering, elections like this one have occurred before (oftentimes in the 19th century),
and the final result has to be determined by the House of Representatives among the three top electoral
vote getters. So, this election would come down to Aquafina, Nestle, and Arrowhead. Given Aquafina
has the most electoral votes and states won outright, we’d probably give the advantage to them, but
stranger things have definitely happened!
As previously mentioned, this data is a by-product of what we standardly collect in our TBSM (The Brand
Strength Monitor) platform. It is the ONLY independently validated measure of brand value.
Each month, we collect 1,000 respondents for each category, which standardly include roughly the following demographic breakouts for brand choice and category penetration:
- Females: 500
- Males: 500
- African-Americans: ~130
- Hispanics: ~100
- Millennials (Age 35 and Under): ~400
- Non-Millennials (Age 36 and Over): ~600
In addition, the following demographics are also standardly available in many different splits:
- Yes/No Children in Household
- If Yes, Age of Children in Household
- Education Level
- Some High School, High School Diploma, Bachelor’s Degree, Master’s Degree, etc.
- Income Level
- Split 15 ways from $7,500 or less to $200,000 or more
- Marital Status
- Single, Married, Domestic Partnership, Divorced, etc.
- States (as we used in our map above)
- All 50 states + DC, as well as custom regions – if desired
The brands included in this Bottled Water exercise are:
- Aquafina
- Dasani
- Nestle
- Fiji
- Glaceau Smartwater
- Arrowhead
- Poland Spring
- Deer Park
- Evian
- Vitaminwater
- Other
- Dannon
- Perrier
- Aqua Hydrate
- Voss
- Fruit2O
- Propel
- Crystal Geyser
- San Pellegrino
- SoBe
- Volvic
- La Croix
- Hint
- Icelandic
- Real Water
- Essentia
- Gerolsteiner
- Penta
MSW●ARS is already tracking this data for the following categories. Let us know if you see one you are interested in, or if you would like us to begin tracking your category:
- Antiperspirants/Deodorants (Women)
- Antiperspirants/Deodorants (Men)
- Analgesics, Internal
- Athletic Shoes (Women)
- Athletic Shoes (Men)
- Auto Insurance
- Bank Services
- Bar Soap
- Bathroom Tissue
- Bleach or Laundry Whiteners
- Blue Jeans (Women)
- Blue Jeans (Men)
- Body Lotions (Women)
- Body Lotions (Men)
- Bottled Water
- Breakfast Bars
- Cable or Satellite TV Subscriptions
- Caramel/Toffee Snacks
- Casual Dining Restaurants
- Cell Phone Carriers
- Chewing Gum
- Chocolate Candy
- Cloud Data Storage
- Coffee Machines
- Credit Cards
- Energy Drinks
- Fabric Softeners
- Facial Moisturizers for Women
- Facial Tissue
- Fitness Trackers
- Frozen Entrees
- Hair Coloring (Women)
- Hair Coloring (Men)
- Hair Dryers
- Home/Renters Insurance
- Hotels
- Ice Cream
- Kitchen Cleaners
- Laptop Computers
- Laundry Detergent
- Life Insurance
- Light Beer
- Liquid Hand Soap
- Mayonnaise
- Microwave Ovens
- Microwave Popcorn
- Mouthwash
- Online Movies/TV/Video Streaming Services
- Orange Juice
- Packaged Coffee
- Personal Computers
- Products from a Big Box Retailer
- Quick Serve Restaurants
- Salty Snacks
- Sedans
- Smart Watches
- Smartphones
- Streaming Media Players
- Tablet Computers
- Tea
- Televisions
- Trucks
- Yogurt
If you see some data you would like to see expanded upon, please send us a note at sales@thebrandstrengthmonitor.com.