
Generally speaking, market leader is a good place to be. Whether premium or value, the brand should reap advantages of scale in manufacturing, logistics, leverage with suppliers and retailers and so forth. While a leader will defend its position in the market through methods such as maintaining awareness and reinforcing core equities through consumer promotion, ensuring product quality and availability and on-going efforts at innovation, it may find difficulty in growing volume through increased market share.

One strategy we all learned in MKTG 101 for a brand not willing or in position to become a cash cow is to grow the category. While brands in high penetration categories may seek to expand the category through promoting new uses for the product type, others may seek to bring non-users into the category. A generally accepted assumption in this latter approach is that the category leader will benefit disproportionately from an increasing overall pie, as category non-participants are most likely to be familiar with the largest brand and hence would be most likely to default to that brand when entering into the category for the first time.
It is this assumption that we decided to investigate for empirical support. Is it an ironclad strategy for a market leader looking to enhance volume without clawing share from amongst its smaller rivals? Or is there some risk that its efforts to coax new consumers into the category might contribute more than expected to the topline of its competitors?
MSW●ARS currently tracks brand preference in approximately sixty diverse categories (representing FMCG, technology, services, retail, automotive, restaurants, soft goods and durables) in the U.S. through The Brand Strength Monitor (TBSM), the only independently validated measure of brand value. For each of these categories TBSM collects behavioral brand choice from 1000 demographically representative adults each month.
With between 10 and 13 cumulative months of continuous tracking per category, the available data is quite robust. It was used to first identify the current category leader in terms of brand preference among those active in the category (category purchasers/users). Then preference for the leader was examined among those not active in the category (non-purchasers/users who either intend to become active in the category within the next six months or who state they are not currently interested in the category).
The results of this investigation show that there is a strong correlation between preference for the category leader among purchasers/users and those not involved in the category, as conventional wisdom would suggest.
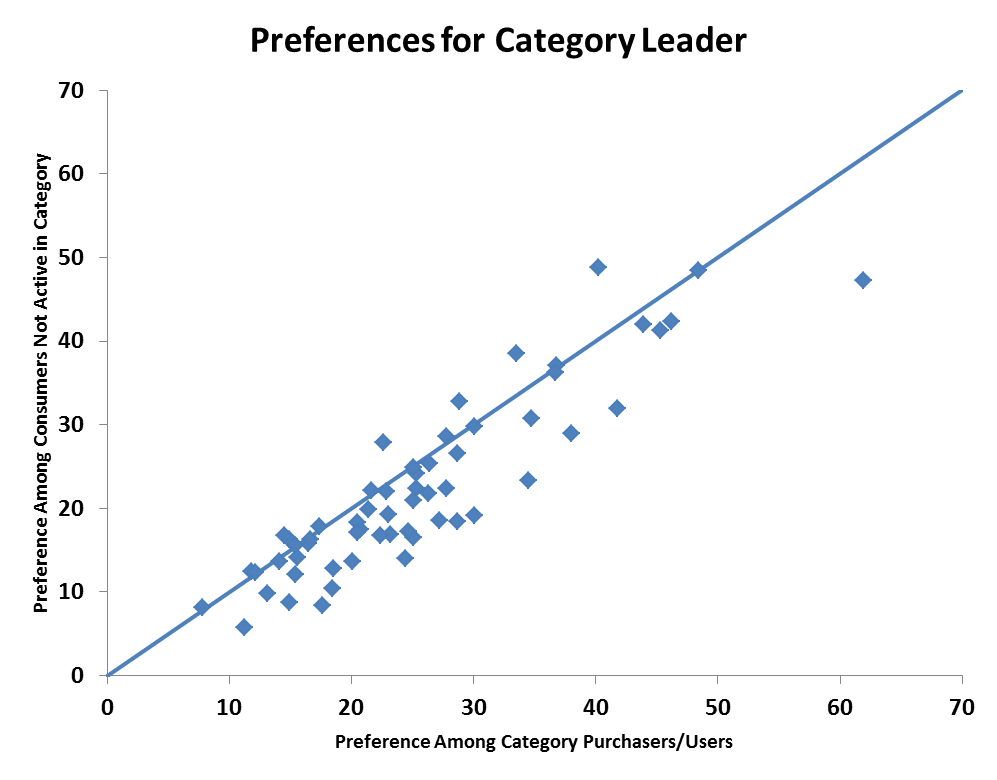
However, there are a substantial number of brands (mainly those with relatively lower share of preference) which are leaders among category participants but not among non-purchasers/users of the category. In addition, preference among those not currently active in the category has a strong tendency to be lower – in some cases by quite a large margin..
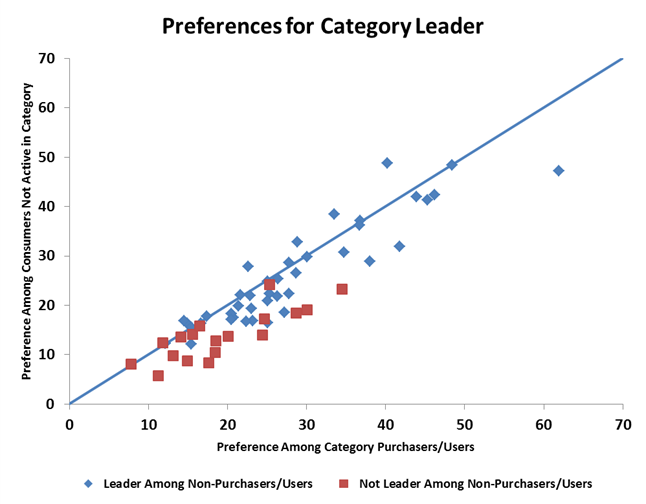
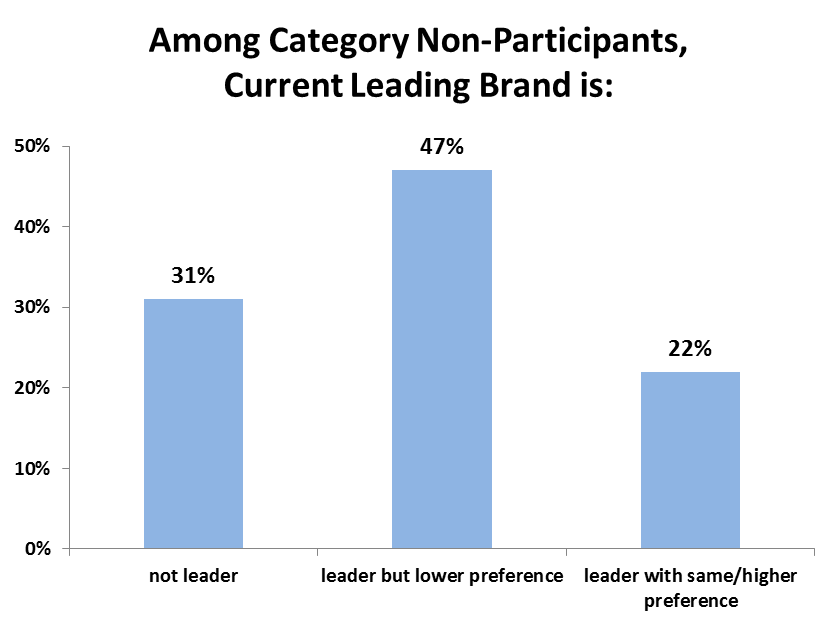
More specifically, in 31% of categories the brand most preferred by those consumers not involved in the category is different from the leading brand amongst those consumers involved in the category. Furthermore, in 78% of categories studied the preference for the current brand leader was lower among category non-participants. Note that results are similar when examining only the 30 categories with under 80-percent category penetration..
So while there is surely something to conventional wisdom, these results indicate that category leaders cannot be assured of disproportionately benefiting from an expansion of category volume. Brands which find themselves with substantially lower preference among non-category participants should cautiously approach a category expansion strategy, ensuring that beyond selling the category they also differentiate themselves and give non-users a reason to try them first.
Some observations from examining the specific cases include:
Some observations from examining the specific cases include:
- Non-leading brands with strong equity in flanking categories appear to be more likely to usurp the leading position among non-category participants, especially when the category leader is not in a similar position in other categories.
- Leading brands toward the premium end of the spectrum appear somewhat less likely to lose their leadership position among those not involved in the category.
- For the seven tech categories represented in the dataset, in all cases the leading brand among purchasers/users retained that position among non-category involved consumers.
- In some cases the category leader may face unfavorable demographics among consumers not active in the category. For example in the auto insurance category State Farm is the leader among purchasers/users. However, AAA has stronger preference among younger consumers who make up a substantially larger proportion of non-category involved consumers than they do purchasers/users. As a result, AAA is the leader overall among non-category purchasers/users.
Certainly growing overall category volume can be an effective way for large brands to increase their sales. Understanding brand preference dynamics of consumers currently outside the category can help leading brands understand potential obstacles in implementing such a strategy. For more information on The Brand Strength Monitor please send us a note at sales@thebrandstrengthmonitor.com.
If you would like to know more regarding the data and platform used here, please contact us at sales@thebrandstrengthmonitor.com
Our TBSM metric is the ONLY Independently Validated Measure of Brand Value.